Balbharti Maharashtra State Board Class 10 Maths Solutions
covers the Practice Set 6.4 Algebra 10th Class Maths Part 1 Answers Solutions Chapter 6 Statistics.
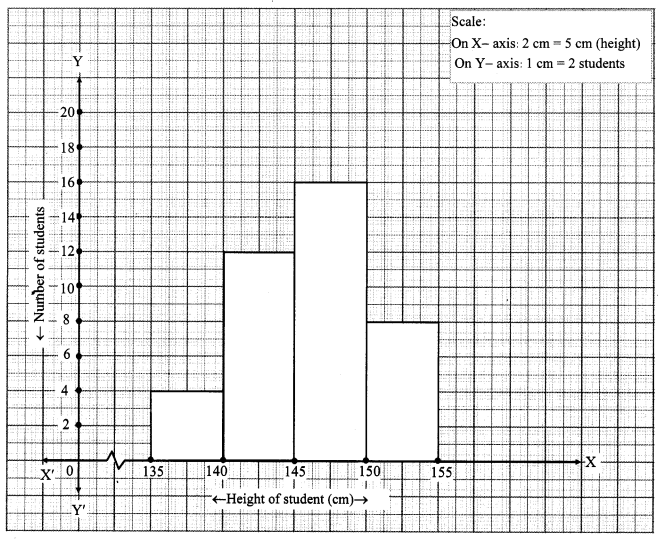
Question 1.
Draw a histogram of the following data.
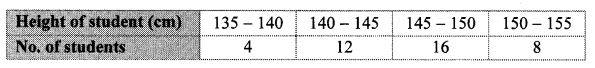
Solution:
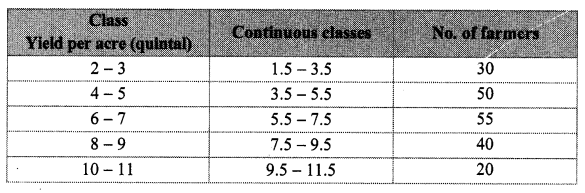
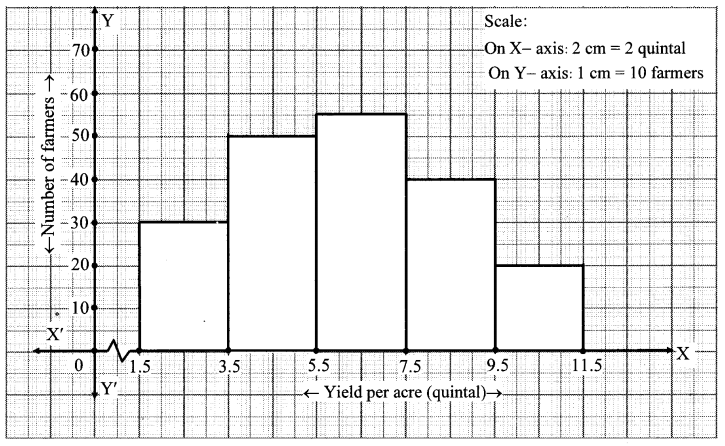
Question 2.
The table below shows the yield of jowar per acre. Show the data by histogram.
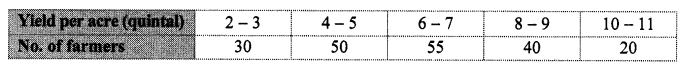
Solution:
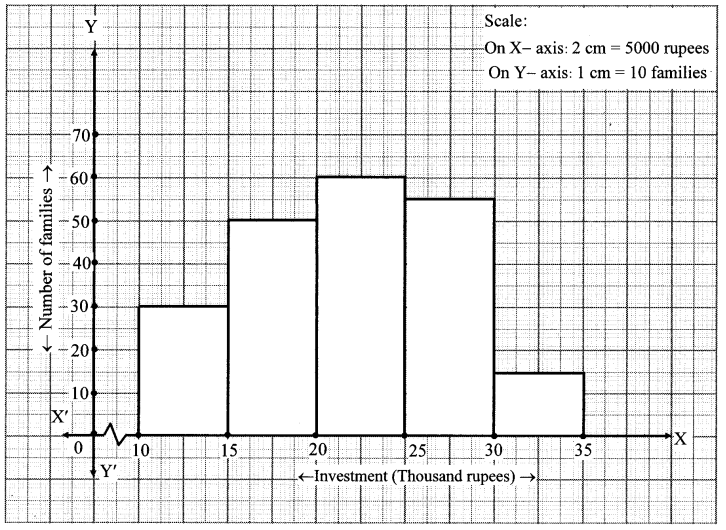
Question 3.
In the following table, the investment made by 210 families is shown. Present it in the form of a histogram.
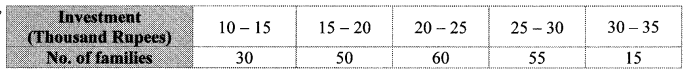
Solution:
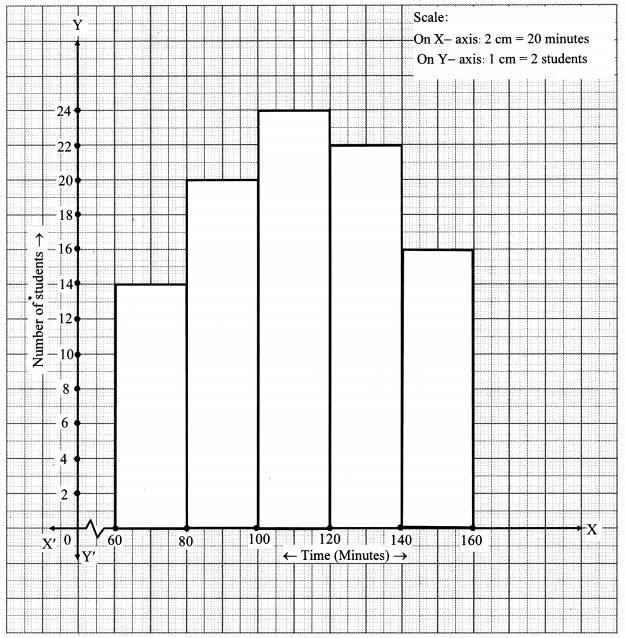
Question 4.
Time allotted for the preparation of an examination by some students is shown in the table. Draw a histogram to show the information.

Solution:
covers the Practice Set 6.4 Algebra 10th Class Maths Part 1 Answers Solutions Chapter 6 Statistics.
Question 1.
Draw a histogram of the following data.
Solution:
Question 2.
The table below shows the yield of jowar per acre. Show the data by histogram.
Solution:
Question 3.
In the following table, the investment made by 210 families is shown. Present it in the form of a histogram.
Solution:
Question 4.
Time allotted for the preparation of an examination by some students is shown in the table. Draw a histogram to show the information.
Solution: