Balbharti Maharashtra State Board Class 10 Maths Solutions
covers the Problem Set 6 Algebra 10th Class Maths Part 1 Answers Solutions Chapter 6 Statistics.
10th Geometry Problem Set 6 Question 1.
Find the correct answer from the alternatives given.
i. The persons of O – blood group are 40%. The classification of persons based on blood groups is to be shown by a pie diagram. What should be the measures of angle for the persons of O – blood group?
(A) 114°
(B) 140°
(C) 104°
(D) 144°
Answer:
Measure of the central angle = \(\frac { 40 }{ 100 } \) × 360° = 144°
(D)
ii. Different expenditures incurred on the construction of a building were shown by a pie diagram. The expenditure of ₹ 45,000 on cement was shown by a sector of central angle of 75°. What was the total expenditure of the construction?
(A) 2,16,000
(B) 3,60,000
(C) 4,50,000
(D) 7,50,000
Answer:
Measure of the central angle = \(\frac{\text { Expenditure of cement }}{\text { Total expenditure }} \times 360^{\circ}\)
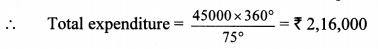
(A)
iii. Cumulative frequencies in a grouped frequency table are useful to find.
(A) Mean
(B) Median
(C) Mode
(D) All of these
Answer:
(B)
iv. The formula to find mean from a grouped frequency table is \(\overline{\mathrm{X}}=\mathrm{A}+\frac{\sum f_{i} u_{i}}{\sum f_{i}} \times g\)
in the formula ui = _________.

Answer:
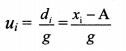
(C)
v.

The median of the distances covered per litre shown in the above data is in the group
(A) 12 – 14
(B) 14 – 16
(C) 16 – 18
(D) 18 – 20
Answer:
(C)
vi.

The above data is to be shown by a frequency polygon. The coordinates of the points to show number of students in the class 4 – 6 are.
(A) (4, 8)
(B) (3,5)
(C) (5,8)
(D) (8,4)
Answer:
Class mark = 5
Frequency = 8
∴ Co-ordinates of the point = (5, 8)
(C)
Statistics Problem Set 6 Question 2.
The following table shows the income of farmers in a grape season. Find the mean of their income.
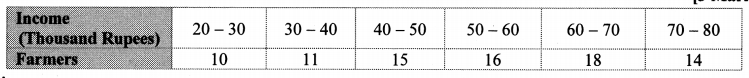
Solution:
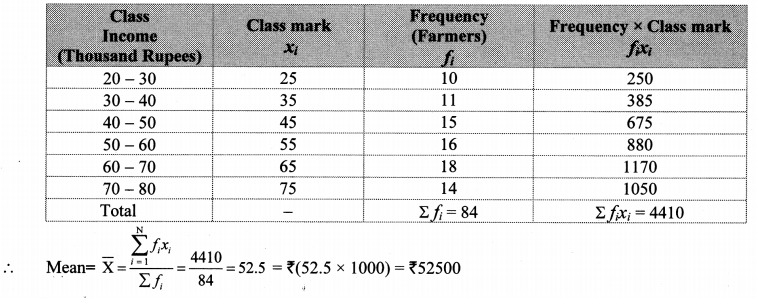
∴ The mean of the income of the farmers is ₹ 52,500.
Statistics Problem Set Question 3.
The loans sanctioned by a bank for construction of farm ponds are shown in the following table. Find the mean of the loans.
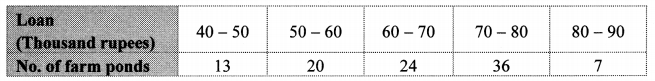
Solution:
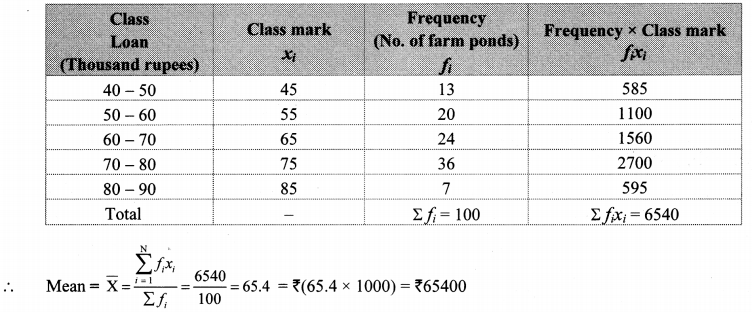
∴ The mean of the loans given by the bank is ₹ 65,400.
Question 4.
The weekly wages of 120 workers in a factory are shown in the following frequency distribution table. Find the mean of the weekly wages.
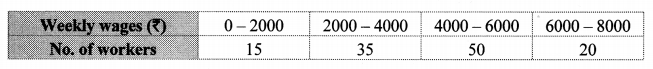
Solution:
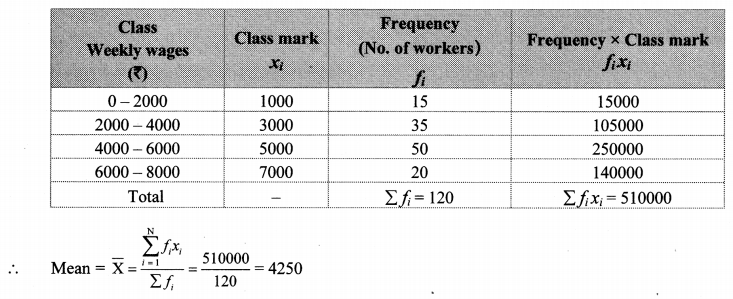
∴ The mean of the weekly wages of the workers is ₹ 4250.
Problem Set 6 Algebra Class 9 Question 5.
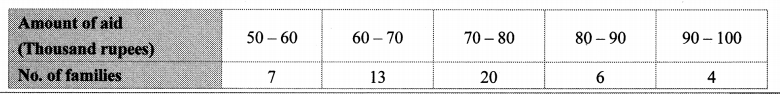
The following frequency distribution table shows the amount of aid given to 50 flood affected families. Find the mean of the amount of aid.
Solution:
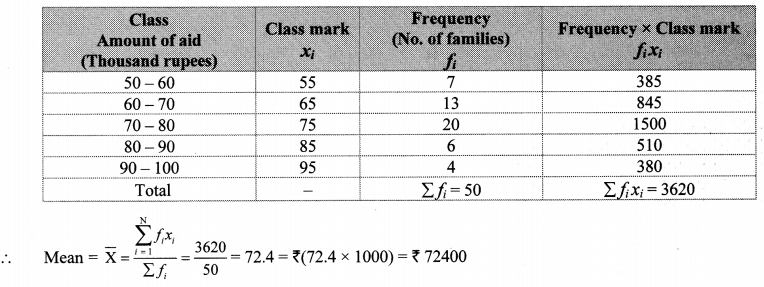
∴ The mean of the amount of aid given to families is ₹ 72,400.
[Note: The above problems are solved using direct method. Students can solve these problems by using other method.]
Problem Set 6 Algebra Class 10 Question 6.
The distances covered by 250 public transport buses in a day is shown in the following frequency distribution table. Find the median of the distances.

Solution:
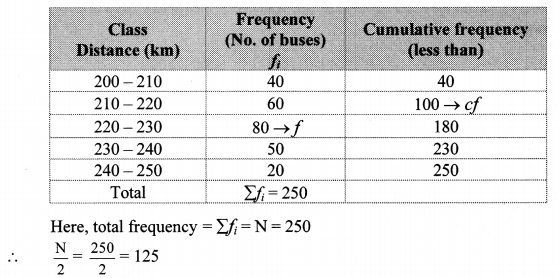
Cumulative frequency which is just greater than (or equal) to 125 is 180.
∴ The median class is 220 – 230.
Now, L = 220, f = 80, cf = 100, h = 10
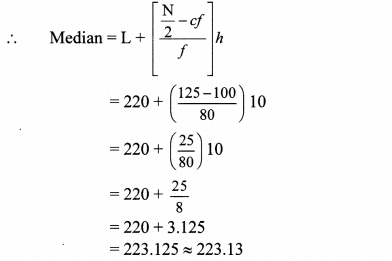
∴ The median of the distances is 223.13 km (approx.).
Algebra 10th Class Problem Set 6 Question 7.
The prices of different articles and demand for them is shown in the following frequency distribution table. Find the median of the prices.

Solution:
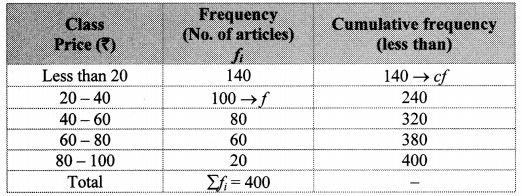
Cumulative frequency which is just greater than (or equal) to 200 is 240.
∴ The median class is 20 – 40.
Now,L = 20, f = 100,cf = 140, h = 20
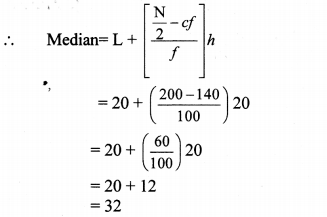
∴ The median of the prices of different articles is ₹ 32.
10th Algebra Problem Set 6 Question 8.
The following frequency table shows the demand for a sweet and the number of customers. Find the mode of demand of sweet.
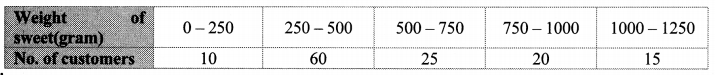
Solution:
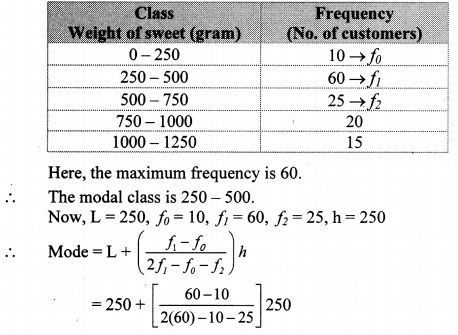
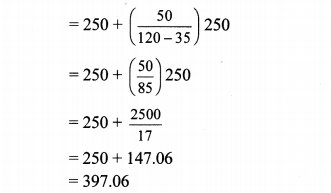
∴ The mode of the demand of sweet is 397.06 grams.
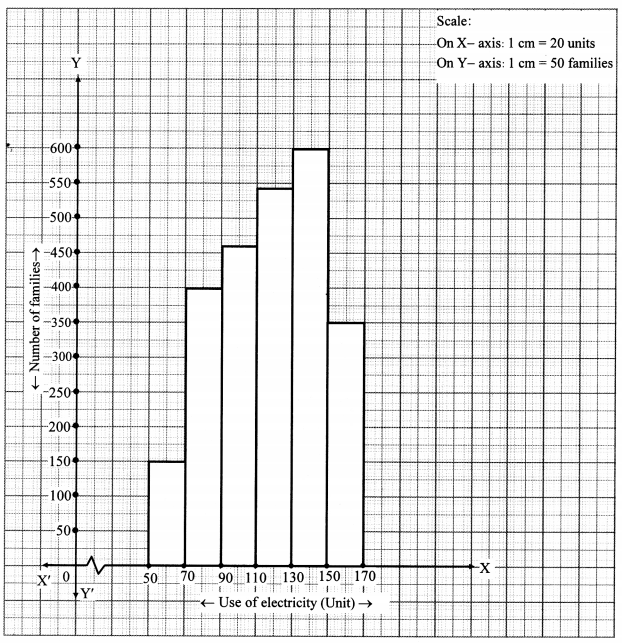
Question 9.
Draw a histogram for the following frequency distribution.

Solution:
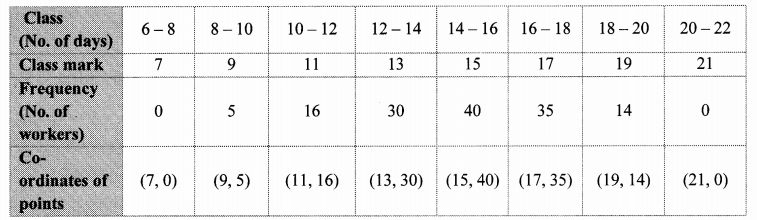
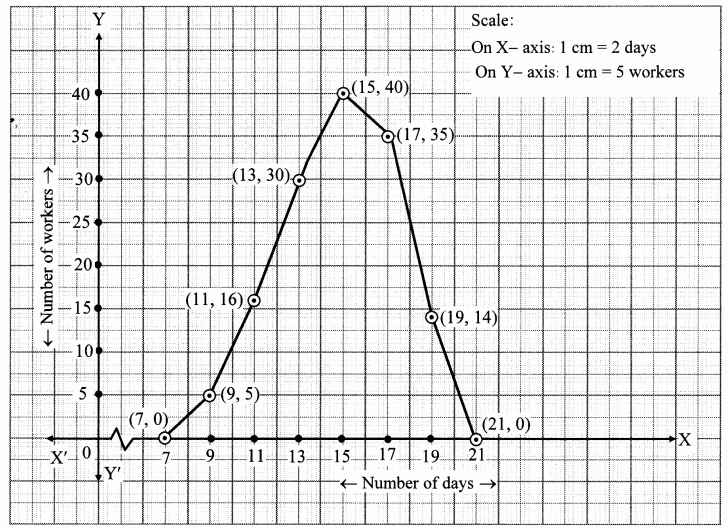
Question 10.
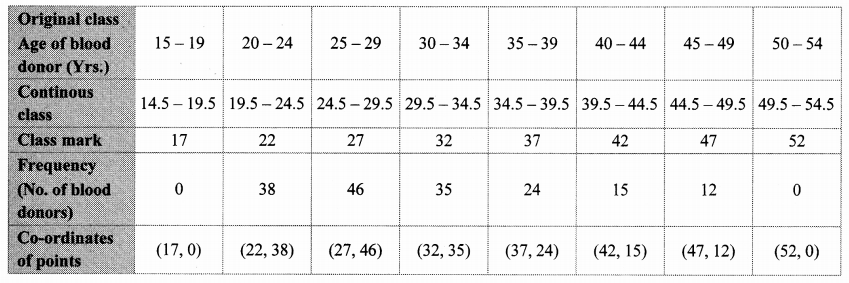
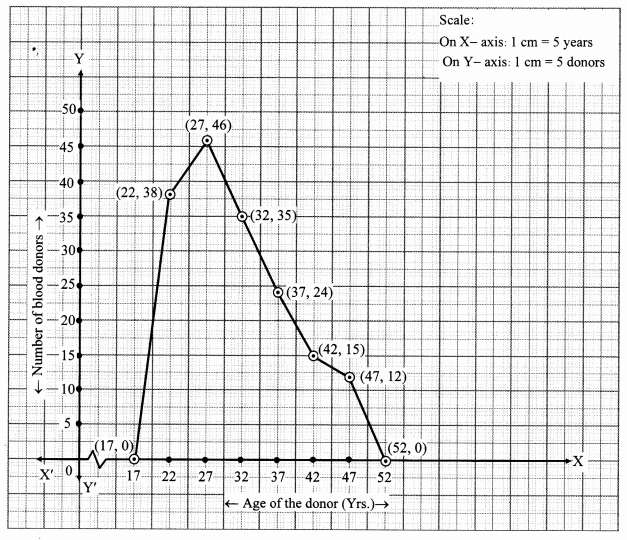
In a handloom factory different workers take different periods of time to weave a saree. The number of workers and their required periods are given below. Present the information by a frequency polygon.

Solution:
Problem Set 6 Question 11.
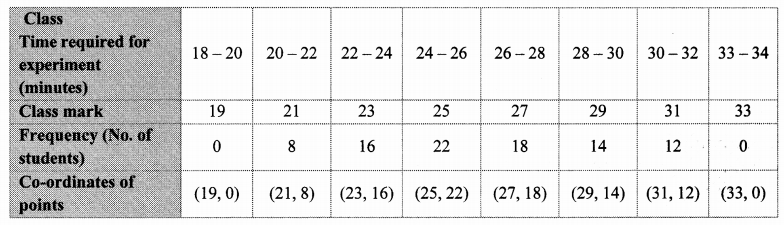
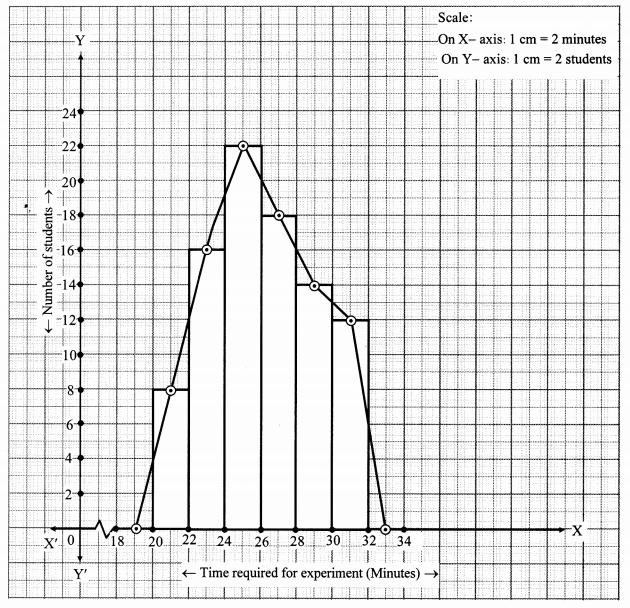
The time required for students to do a science experiment and the number of students is shown in the following grouped frequency distribution table. Show the information by a histogram and also by a frequency polygon.
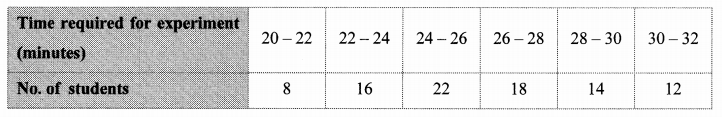
Solution:
Question 12.
Draw a frequency polygon for the following grouped frequency distribution table.
Solution:
Question 13.
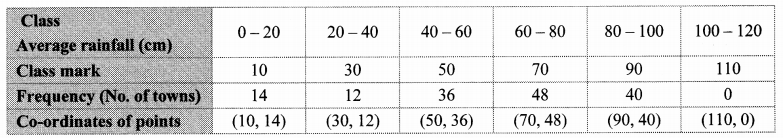
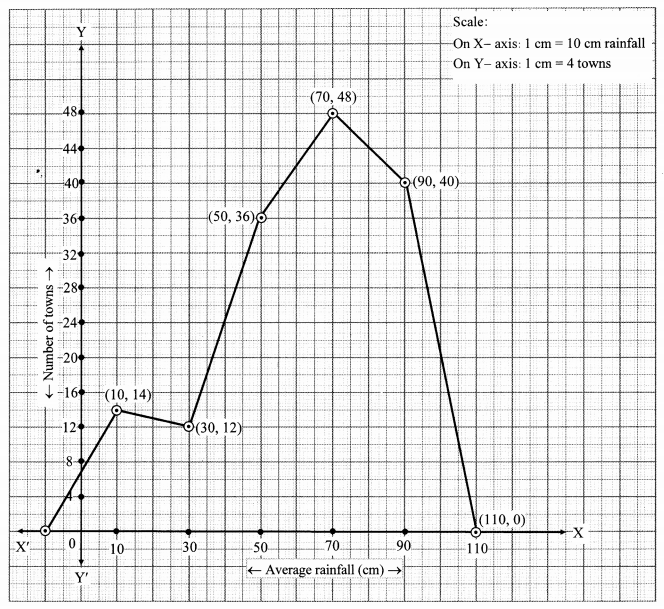
The following table shows the average rainfall in 150 towns. Show the information by a frequency polygon.

Solution:
Question 14.
Observe the given pie diagram. It shows the percentages of number of vehicles passing a signal in a town between 8 am and 10 am.
i. Find the central angle for each type of vehicle.
ii. If the number of two-wheelers is 1200, find the number of all vehicles.
Solution:
∴ The total number of vehicles is 3000.
Problem Set 6 Geometry Class 10 Question 15.
The following table shows causes of noise pollution. Show it by a pie diagram.
Solution:
Question 16.
A survey of students was made to know which game they like. The data obtained in the survey is
presented in the given pie diagram. If the total number of students are 1000,
i. how many students like cricket?
ii. how many students like football?
iii. how many students prefer other games?
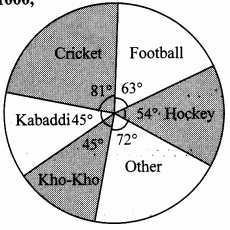
Solution:
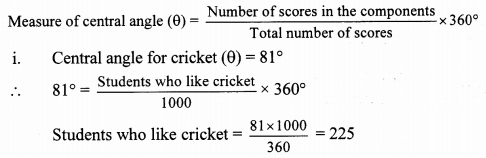
∴ 225 students like cricket.
ii. Central angle for football (θ) = 63°
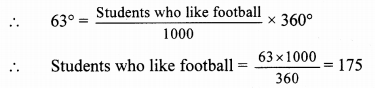
∴ 175 students like football.
iii. Central angle for other games (θ) = 72°
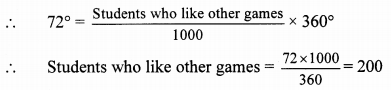
∴ 200 students like other games.
Question 17.
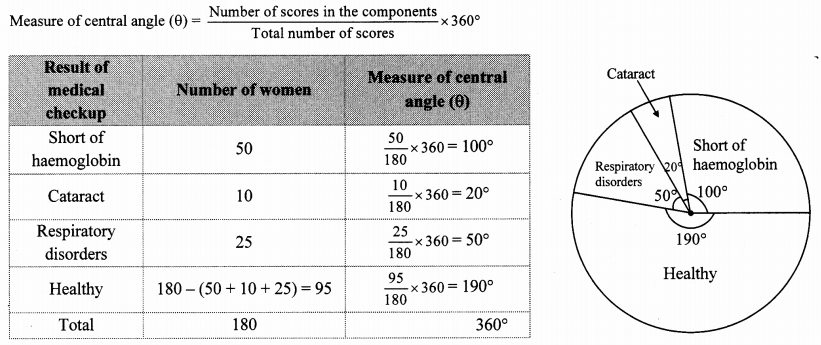
Medical check up of 180 women was conducted in a health centre in a village. 50 of them were short of hemoglobin, 10 suffered from cataract and 25 had respiratory disorders. The remaining women were healthy. Show the information by a pie diagram.
Solution:
Total number of women = 180
Question 18.
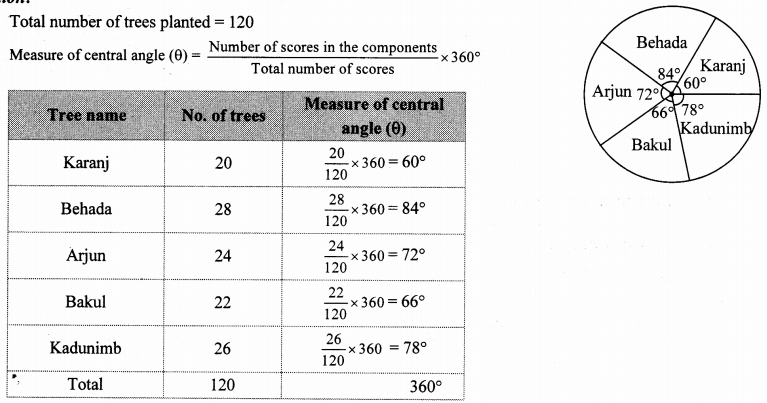
On an environment day, students in a school planted 120 trees under plantation project. The information regarding the project is shown in the following table. Show it by a pie diagram.
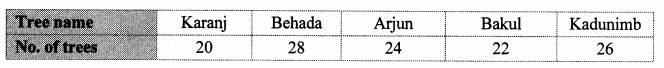
Solution:
Total number of trees planted = 120
covers the Problem Set 6 Algebra 10th Class Maths Part 1 Answers Solutions Chapter 6 Statistics.
10th Geometry Problem Set 6 Question 1.
Find the correct answer from the alternatives given.
i. The persons of O – blood group are 40%. The classification of persons based on blood groups is to be shown by a pie diagram. What should be the measures of angle for the persons of O – blood group?
(A) 114°
(B) 140°
(C) 104°
(D) 144°
Answer:
Measure of the central angle = \(\frac { 40 }{ 100 } \) × 360° = 144°
(D)
ii. Different expenditures incurred on the construction of a building were shown by a pie diagram. The expenditure of ₹ 45,000 on cement was shown by a sector of central angle of 75°. What was the total expenditure of the construction?
(A) 2,16,000
(B) 3,60,000
(C) 4,50,000
(D) 7,50,000
Answer:
Measure of the central angle = \(\frac{\text { Expenditure of cement }}{\text { Total expenditure }} \times 360^{\circ}\)
(A)
iii. Cumulative frequencies in a grouped frequency table are useful to find.
(A) Mean
(B) Median
(C) Mode
(D) All of these
Answer:
(B)
iv. The formula to find mean from a grouped frequency table is \(\overline{\mathrm{X}}=\mathrm{A}+\frac{\sum f_{i} u_{i}}{\sum f_{i}} \times g\)
in the formula ui = _________.
Answer:
(C)
v.
The median of the distances covered per litre shown in the above data is in the group
(A) 12 – 14
(B) 14 – 16
(C) 16 – 18
(D) 18 – 20
Answer:
(C)
vi.
The above data is to be shown by a frequency polygon. The coordinates of the points to show number of students in the class 4 – 6 are.
(A) (4, 8)
(B) (3,5)
(C) (5,8)
(D) (8,4)
Answer:
Class mark = 5
Frequency = 8
∴ Co-ordinates of the point = (5, 8)
(C)
Statistics Problem Set 6 Question 2.
The following table shows the income of farmers in a grape season. Find the mean of their income.
Solution:
∴ The mean of the income of the farmers is ₹ 52,500.
Statistics Problem Set Question 3.
The loans sanctioned by a bank for construction of farm ponds are shown in the following table. Find the mean of the loans.
Solution:
∴ The mean of the loans given by the bank is ₹ 65,400.
Question 4.
The weekly wages of 120 workers in a factory are shown in the following frequency distribution table. Find the mean of the weekly wages.
Solution:
∴ The mean of the weekly wages of the workers is ₹ 4250.
Problem Set 6 Algebra Class 9 Question 5.
The following frequency distribution table shows the amount of aid given to 50 flood affected families. Find the mean of the amount of aid.
Solution:
∴ The mean of the amount of aid given to families is ₹ 72,400.
[Note: The above problems are solved using direct method. Students can solve these problems by using other method.]
Problem Set 6 Algebra Class 10 Question 6.
The distances covered by 250 public transport buses in a day is shown in the following frequency distribution table. Find the median of the distances.
Solution:
Cumulative frequency which is just greater than (or equal) to 125 is 180.
∴ The median class is 220 – 230.
Now, L = 220, f = 80, cf = 100, h = 10
∴ The median of the distances is 223.13 km (approx.).
Algebra 10th Class Problem Set 6 Question 7.
The prices of different articles and demand for them is shown in the following frequency distribution table. Find the median of the prices.
Solution:
Cumulative frequency which is just greater than (or equal) to 200 is 240.
∴ The median class is 20 – 40.
Now,L = 20, f = 100,cf = 140, h = 20
∴ The median of the prices of different articles is ₹ 32.
10th Algebra Problem Set 6 Question 8.
The following frequency table shows the demand for a sweet and the number of customers. Find the mode of demand of sweet.
Solution:
∴ The mode of the demand of sweet is 397.06 grams.
Question 9.
Draw a histogram for the following frequency distribution.
Solution:
Question 10.
In a handloom factory different workers take different periods of time to weave a saree. The number of workers and their required periods are given below. Present the information by a frequency polygon.
Solution:
Problem Set 6 Question 11.
The time required for students to do a science experiment and the number of students is shown in the following grouped frequency distribution table. Show the information by a histogram and also by a frequency polygon.
Solution:
Question 12.
Draw a frequency polygon for the following grouped frequency distribution table.
Solution:
Question 13.
The following table shows the average rainfall in 150 towns. Show the information by a frequency polygon.
Solution:
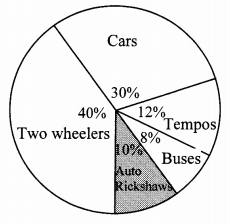
Question 14.
Observe the given pie diagram. It shows the percentages of number of vehicles passing a signal in a town between 8 am and 10 am.
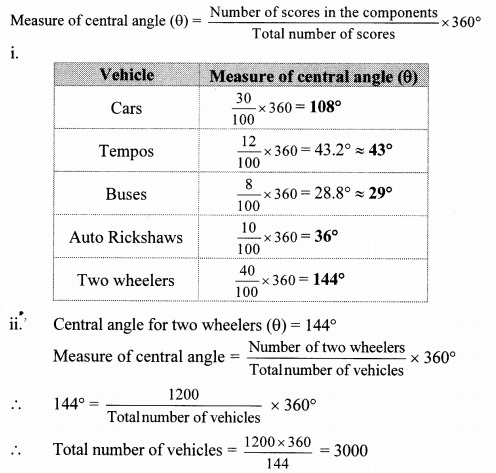
i. Find the central angle for each type of vehicle.
ii. If the number of two-wheelers is 1200, find the number of all vehicles.
Solution:
∴ The total number of vehicles is 3000.
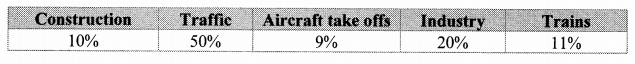
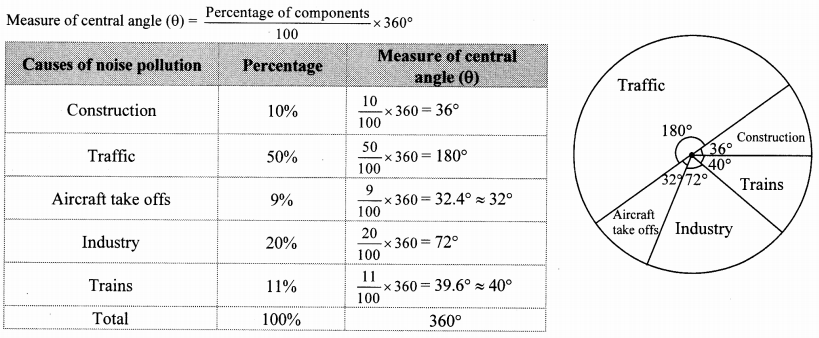
Problem Set 6 Geometry Class 10 Question 15.
The following table shows causes of noise pollution. Show it by a pie diagram.
Solution:
Question 16.
A survey of students was made to know which game they like. The data obtained in the survey is
presented in the given pie diagram. If the total number of students are 1000,
i. how many students like cricket?
ii. how many students like football?
iii. how many students prefer other games?
Solution:
∴ 225 students like cricket.
ii. Central angle for football (θ) = 63°
∴ 175 students like football.
iii. Central angle for other games (θ) = 72°
∴ 200 students like other games.
Question 17.
Medical check up of 180 women was conducted in a health centre in a village. 50 of them were short of hemoglobin, 10 suffered from cataract and 25 had respiratory disorders. The remaining women were healthy. Show the information by a pie diagram.
Solution:
Total number of women = 180
Question 18.
On an environment day, students in a school planted 120 trees under plantation project. The information regarding the project is shown in the following table. Show it by a pie diagram.
Solution:
Total number of trees planted = 120