Balbharti Maharashtra State Board Class 6 Maths Solutions
covers the Std 6 Maths Chapter 6 Bar Graphs Class 6 Practice Set 18 Answers Solutions.
Question 1.
This bar graph shows the maximum temperatures in degrees Celsius in different cities on a certain day in February. Observe the graph and answer the questions:
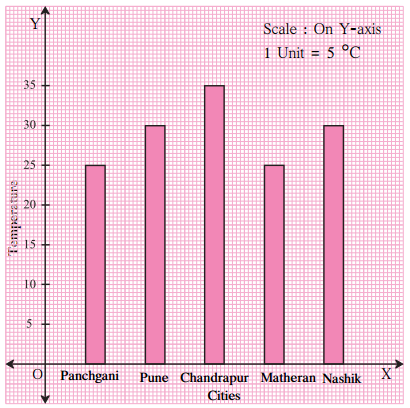
Solution:
Question 1.
Observe the picture alongside: (Textbook pg. no. 35)
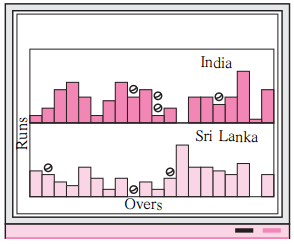
Ans:
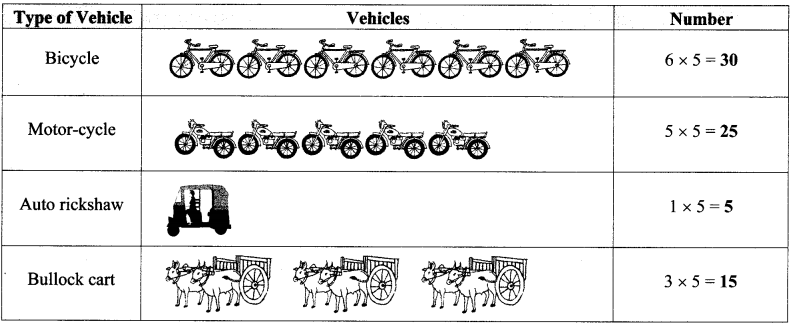
Question 2.
A pictogram of the types and numbers of vehicles in a city is given below.
Taking 1 picture = 5 vehicles, write the numbers in the pictogram. (Textbook pg. no.35)
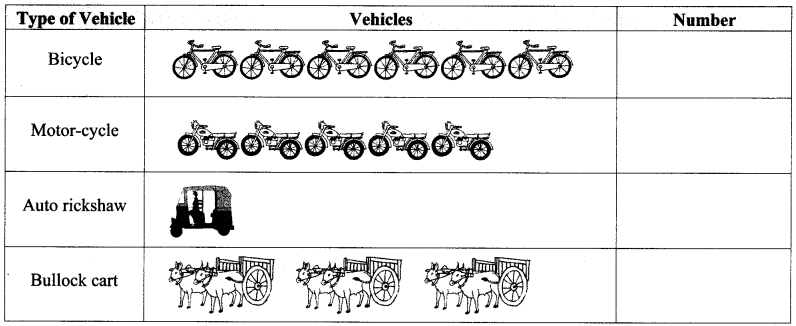
Solution:
Drawing pictograms is time consuming.
Sometimes, it is practically not possible to draw pictures for the given values (for example population of villages etc). In such cases, representing the data by making use of graphs can serve the purpose. Such data can be represented by using graphs.
covers the Std 6 Maths Chapter 6 Bar Graphs Class 6 Practice Set 18 Answers Solutions.
Question 1.
This bar graph shows the maximum temperatures in degrees Celsius in different cities on a certain day in February. Observe the graph and answer the questions:
Solution:
Question 1.
Observe the picture alongside: (Textbook pg. no. 35)
Ans:
Question 2.
A pictogram of the types and numbers of vehicles in a city is given below.
Taking 1 picture = 5 vehicles, write the numbers in the pictogram. (Textbook pg. no.35)
Solution:
Drawing pictograms is time consuming.
Sometimes, it is practically not possible to draw pictures for the given values (for example population of villages etc). In such cases, representing the data by making use of graphs can serve the purpose. Such data can be represented by using graphs.