Balbharati Maharashtra State Board 11th Commerce Maths Solution Book Pdf
Chapter 1 Partition Values Ex 1.2 Questions and Answers.
Question 1.
Calculate D6 and P85 for the following data:
79, 82, 36, 38, 51, 72, 68, 70, 64, 63
Solution:
The given data can be arranged in ascending order as follows:
36, 38, 51, 63, 64, 68, 70, 72, 79, 82
Here, n = 10
D6 = value of 6\(\left(\frac{n+1}{10}\right)^{\text {th }}\) observation
= value of 6\(\left(\frac{10+1}{10}\right)^{\text {th }}\) observation
= value of (6 × 1.1)th observation
= value of (6.6)th observation
= value of 6th observation + 0.6(value of 7th observation – value of 6th observation)
= 68 + 0.6(70 – 68)
= 68 + 0.6(2)
= 68 + 1.2
∴ D6 = 69.2
P85 = value of \(\left(\frac{n+1}{100}\right)^{\text {th }}\) observation
= value of \(\left(\frac{10+1}{100}\right)^{\text {th }}\) observation
= value of (85 × 0. 11)th observation
= value of (9.35)th observation
= value of 9th observation + 0.35(value of 10th observation – value of 9th observation)
= 19 + 0.35(82 – 79)
= 79 + 0.35(3)
= 79 + 1.05
∴ P85 = 80.05

Question 2.
The daily wages (in ₹) of 15 labourers are as follows:
230, 400, 350, 200, 250, 380, 210, 225, 375, 180, 375, 450, 300, 350, 250
Calculate D8 and P90.
Solution:
The given data can be arranged in ascending order as follows:
180, 200, 210, 225, 230, 250, 250, 300, 350, 350, 375, 375, 380, 400, 450
Here, n = 15
D8 = value of 8\(\left(\frac{n+1}{10}\right)^{\text {th }}\) observation
= value of 8\(\left(\frac{15+1}{10}\right)^{\text {th }}\) observation
= value of (8 × 1.6)th observation
= value of (12.8)th observation
= value of 12th observation – 0.8(value of 13th observation – value of 12th observation)
= 375 + 0.8(380 – 375)
= 375 + 0.8(5)
= 375 + 4
∴ D8 = 379
P90 = value of 90\(\left(\frac{n+1}{10}\right)^{\text {th }}\) observation
= value of 90\(\left(\frac{15+1}{100}\right)^{\text {th }}\) observation
= value of (90 × 0.16)th observation
= value of (14.4)th observation
= value of 14th observation + 0.4 (value of 15th observation – value of 14th observation)
= 400 + 0.4(450 – 400)
= 400 + 0.4(50)
= 400 + 20
∴ P90 = 420
Question 3.
Calculate 2nd decile and 65th percentile for the following:
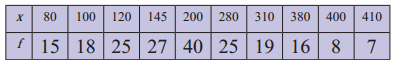
Solution:
We construct the less than cumulative frequency table as given below:
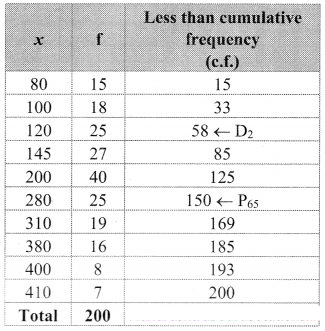
Here, n = 200
D2 = value of 2\(\left(\frac{n+1}{10}\right)^{\text {th }}\) observation
= value of 2\(\left(\frac{200+1}{10}\right)^{\text {th }}\) observation
= value of (2 × 20.1)th observation
= value of (40.2)th observation
Cumulative frequency which is just greater than (or equal to) 40.2 is 58.
∴ D2 = 120
P65 = value of 65\(\left(\frac{n+1}{100}\right)^{\text {th }}\) observation
= value of 65\(\left(\frac{200+1}{100}\right)^{\text {th }}\) observation
= value of (65 × 2.01)th observation
= value of (130.65)th observation
The cumulative frequency which is just greater than (or equal to) 130.65 is 150.
∴ P65 = 280
Question 4.
From the following data calculate the rent of the 15th, 65th, and 92nd house.
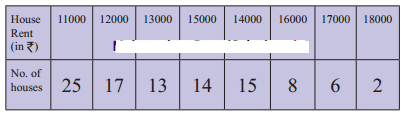
Solution:
Arranging the given data in ascending order.
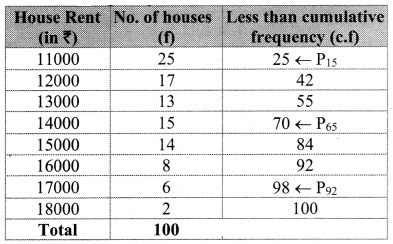
Here, n = 100
P15 = value of 15
= value of 15\(\left(\frac{n+1}{100}\right)^{\text {th }}\) observation
= value of 15\(\left(\frac{100+1}{100}\right)^{\text {th }}\) observation
= value of (15 × 1.01 )th observation
= value of (15.15)th observation
Cumulative frequency which is just greater than (or equal to) 15.15 is 25.
∴ P15 = 11000
P65 = value of 65\(\left(\frac{n+1}{100}\right)^{\text {th }}\)observation
= value of 65\(\left(\frac{100+1}{100}\right)^{\text {th }}\) observation
= value of (65 × 1.01)th observation
= value of (65.65)th observation
Cumulative frequency which is just greater than (or equal to) 65.65 is 70.
∴ P65 = 14000
P92 = value of 92\(\left(\frac{n+1}{100}\right)^{\text {th }}\) observation
= value of 92\(\left(\frac{100+1}{100}\right)^{\text {th }}\) observation
= value of (92 × 1.01)th observation
= value of (92.92)th observation
Cumulative frequency which is just greater than (or equal to) 92.92 is 98.
∴ P92 = 17000
Question 5.
The following frequency distribution shows the weight of students in a class.
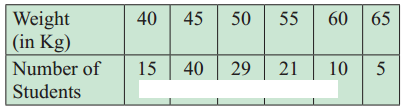
(a) Find the percentage of students whose weight is more than 50 kg.
(b) If the weight column provided is of mid values then find the percentage of students whose weight is more than 50 kg.
Solution:
(a) Let the percentage of students weighing less than 50 kg be x.
∴ Px = 50
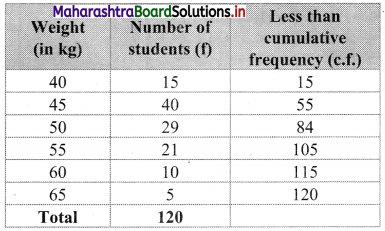
From the table, out of 20 students, 84 students have their weight less than 50 kg.
∴ Number of students weighing more than 50 kg = 120 – 84 = 36
∴ Percentage of students having there weight more than 50 kg = \(\frac{36}{120}\) × 100 = 30%
(b) The difference between any two consecutive mid values of weight is 5 kg.
The class intervals must of width 5, with 40, 45,….. as their mid values.
∴ The class intervals will be 37.5 – 42.5, 42.5 – 47.5, etc.
We construct the less than cumulative frequency table as given below:
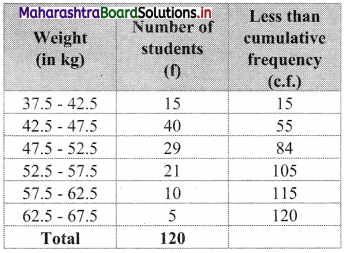
Here, N = 120
Let Px = 50
The value 50 lies in the class 47.5 – 52.5
∴ L = 47.5, h = 5, f = 29, c.f. = 55
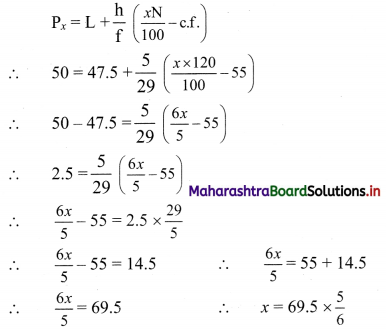
∴ x = 58 (approximately)
∴ 58% of students are having weight below 50 kg.
∴ Percentage of students having weight above 50 kg is 100 – 58 = 42
∴ 42% of students are having weight above 50 kg.
Question 6.
Calculate D4 and P48 from the following data:
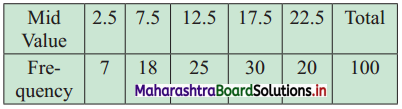
Solution:
The difference between any two consecutive mid values is 5, the width of class interval = 5
∴ Class interval with mid-value 2.5 is 0 – 5
Class interval with mid value 7.5 is 5 – 10, etc.
We construct the less than cumulative frequency table as given below:
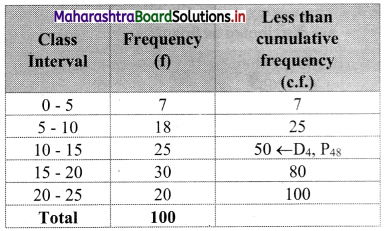
Here, N = 100
D4 class = class containing \(\left(\frac{4 \mathrm{N}}{10}\right)^{\text {th }}\) observation
∴ \(\frac{4 \mathrm{N}}{10}=\frac{4 \times 100}{10}\) = 40
Cumulative frequency which is just greater than (or equal to) 40 is 50.
∴ D4 lies in the class 10 – 15.
∴ L = 10,h = 5, f = 25, c.f. = 25
∴ D4 = \(\mathrm{L}+\frac{\mathrm{h}}{\mathrm{f}}\left(\frac{4 \mathrm{~N}}{10}-\text { c.f. }\right)\)
= 10 + \(\frac{5}{25}\) (40 – 25)
= 10 + \(\frac{1}{5}\) (15)
= 10 + 3
∴ D4 = 13
P48 class = class containing \(\left(\frac{48 \mathrm{~N}}{100}\right)^{\text {th }}\) observation
∴ \(\frac{48 \mathrm{~N}}{100}=\frac{48 \times 100}{100}\) = 48
Cumulative frequency which is just greater than (or equal to) 48 is 50.
∴ P48 lies in the class 10 – 15.
∴ L = 10, h = 5, f = 25, c.f. = 25
∴ P48 = \(\mathrm{L}+\frac{\mathrm{h}}{\mathrm{f}}\left(\frac{48 \mathrm{~N}}{100}-\text { c.f. }\right)\)
= 10 + \(\frac{5}{25}\) (48 – 25)
= 10 + \(\frac{1}{5}\) (23)
= 10 + 4.6
∴ P48 = 14.6
Question 7.
Calculate D9 and P20 of the following distribution.

Solution:
We construct the less than cumulative frequency table as given below:
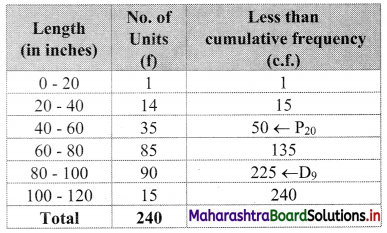
Here, N = 240
D9 class = class containing \(\left(\frac{9 \mathrm{~N}}{10}\right)^{\mathrm{th}}\) observation
∴ \(\frac{9 \mathrm{~N}}{10}=\frac{9 \times 240}{10}\) = 216
Cumulative frequency which is just greater than (or equal to) 216 is 225.
∴ D9 lies in the class 80 – 100.
∴ L = 80, h = 20, f = 90, c.f. = 135
∴ D9 = \(L+\frac{h}{f}\left(\frac{9 N}{10}-c . f .\right)\)
= 80 + \(\frac{20}{90}\)(216 – 135)
= 80 + \(\frac{2}{9}\)(81)
= 80 + 18
∴ D9 = 98
P20 class = class containing \(\left(\frac{20 \mathrm{~N}}{100}\right)^{\text {th }}\) observation
∴ \(\frac{20 \mathrm{~N}}{100}=\frac{20 \times 240}{100}\) = 48
Cumulative frequency which is just greater than (or equal to) 48 is 50.
∴ P20 lies in the class 40 – 60.
∴ L = 40, h = 20, f = 35, c.f. = 15
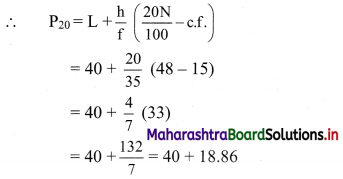
∴ P20 = 58.86
Question 8.
Weekly wages for a group of 100 persons are given below:
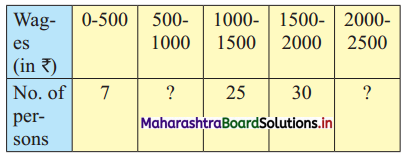
D3 for this group is ₹ 1100. Calculate the missing frequencies.
Solution:
Let a and b be the missing frequencies of class 500 – 1000 and class 2000 – 2500 respectively.
We construct the less than cumulative frequency table as given below:
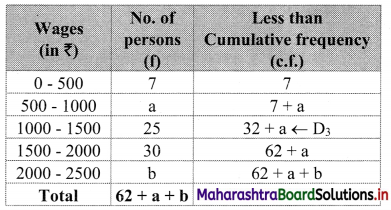
Here, N = 62 + a + b
Since, N = 100
∴ 62 + a + b = 100
∴ a + b = 38 …..(i)
Given, D3 = 1100
∴ D3 lies in the class 1000 – 1500.
∴ L = 1000, h = 500, f = 25, c.f. = 7 + a
∴ \(\frac{3 \mathrm{~N}}{10}=\frac{3 \times 100}{10}=30\)
∴ D3 = \(\mathrm{L}+\frac{\mathrm{h}}{\mathrm{f}}\left(\frac{3 \mathrm{~N}}{10}-\mathrm{c} . \mathrm{f} .\right)\)
∴ 1100 = 1000 + \(\frac{500}{25}\) [30 – (7 + a)]
∴ 1100 – 1000 = 20(30 – 7 – a)
∴ 100 = 20(23 – a)
∴ 100 = 460 – 20a
∴ 20a = 460 – 100
∴ 20a = 360
∴ a = 18
Substituting the value of a in equation (i), we get
18 + b = 38
∴ b = 38 – 18 = 20
∴ 18 and 20 are the missing frequencies of the class 500 – 1000 and class 2000 – 2500 respectively.
Question 9.
The weekly profit (in rupees) of 100 shops are distributed as follows:
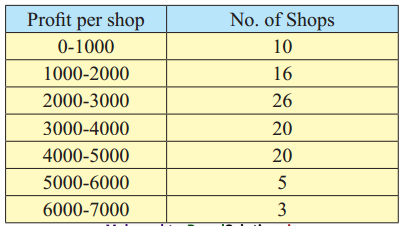
Find the limits of the profit of middle 60% of the shops.
Solution:
To find the limits of the profit of the middle 60% of the shops, we have to find P20 and P80.
We construct the less than cumulative frequency table as given below:
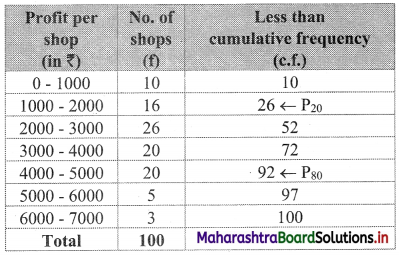
Here, N = 100
P20 class = class containing \(\left(\frac{20 \mathrm{N}}{100}\right)^{\text {th }}\) observation
∴ \(\frac{20 \mathrm{N}}{100}=\frac{20 \times 100}{100}=20\)
Cumulative frequency which is just greater than (or equal to) 20 is 26.
∴ P20 lies in the class 1000 – 2000.
∴ L = 1000, h = 1000, f = 16, c.f. = 10
∴ P20 = \(L+\frac{h}{f}\left(\frac{20 \mathrm{~N}}{100}-\text { c.f. }\right)\)
= 1000 + \(\frac{1000}{16}\) (20 – 10)
= 1000 + \(\frac{125}{2}\) (10)
= 1000 + 625
∴ P20 = 1625
P80 class = class containing \(\left(\frac{80 \mathrm{~N}}{100}\right)^{\text {th }}\) observation
∴ \(\frac{80 \mathrm{~N}}{100}=\frac{80 \times 100}{100}=80\)
Cumulative frequency which is just greater than (or equal to) 80 is 92.
∴ P80 lies in the class 4000 – 5000.
∴ L = 4000, h = 1000, f = 20, c.f. = 72
∴ P80 = \(L+\frac{h}{f}\left(\frac{80 \mathrm{~N}}{100}-\text { c.f. }\right)\)
= 4000 + \(\frac{1000}{20}\)(80 – 72)
= 4000 + 50(8)
= 4000 + 400
∴ P80 = 4400
∴ the profit of middle 60% of the shops lie between the limits ₹ 1,625 to ₹ 4,400.
Question 10.
In a particular factory, workers produce various types of output units. The following distribution was obtained:
Find the percentage of workers who have produced less than 82 output units.
Solution:
Since the given data is not continuous, we have to convert it into a continuous form by subtracting 0.5 from the lower limit and adding 0.5 to the upper limit of every class interval.
∴ the class intervals will be 69.5 – 74.5, 74.5 – 79.5, etc.
We construct the less than cumulative frequency table as given below:
Here, N = 445
Let Px = 82
The value 82 lies in the class 79.5 – 84.5
∴ L = 79.5, h = 5, f = 50, c.f. = 85
∴ 24.72% of workers produced less than 82 output units.
Chapter 1 Partition Values Ex 1.2 Questions and Answers.
Question 1.
Calculate D6 and P85 for the following data:
79, 82, 36, 38, 51, 72, 68, 70, 64, 63
Solution:
The given data can be arranged in ascending order as follows:
36, 38, 51, 63, 64, 68, 70, 72, 79, 82
Here, n = 10
D6 = value of 6\(\left(\frac{n+1}{10}\right)^{\text {th }}\) observation
= value of 6\(\left(\frac{10+1}{10}\right)^{\text {th }}\) observation
= value of (6 × 1.1)th observation
= value of (6.6)th observation
= value of 6th observation + 0.6(value of 7th observation – value of 6th observation)
= 68 + 0.6(70 – 68)
= 68 + 0.6(2)
= 68 + 1.2
∴ D6 = 69.2
P85 = value of \(\left(\frac{n+1}{100}\right)^{\text {th }}\) observation
= value of \(\left(\frac{10+1}{100}\right)^{\text {th }}\) observation
= value of (85 × 0. 11)th observation
= value of (9.35)th observation
= value of 9th observation + 0.35(value of 10th observation – value of 9th observation)
= 19 + 0.35(82 – 79)
= 79 + 0.35(3)
= 79 + 1.05
∴ P85 = 80.05
Question 2.
The daily wages (in ₹) of 15 labourers are as follows:
230, 400, 350, 200, 250, 380, 210, 225, 375, 180, 375, 450, 300, 350, 250
Calculate D8 and P90.
Solution:
The given data can be arranged in ascending order as follows:
180, 200, 210, 225, 230, 250, 250, 300, 350, 350, 375, 375, 380, 400, 450
Here, n = 15
D8 = value of 8\(\left(\frac{n+1}{10}\right)^{\text {th }}\) observation
= value of 8\(\left(\frac{15+1}{10}\right)^{\text {th }}\) observation
= value of (8 × 1.6)th observation
= value of (12.8)th observation
= value of 12th observation – 0.8(value of 13th observation – value of 12th observation)
= 375 + 0.8(380 – 375)
= 375 + 0.8(5)
= 375 + 4
∴ D8 = 379
P90 = value of 90\(\left(\frac{n+1}{10}\right)^{\text {th }}\) observation
= value of 90\(\left(\frac{15+1}{100}\right)^{\text {th }}\) observation
= value of (90 × 0.16)th observation
= value of (14.4)th observation
= value of 14th observation + 0.4 (value of 15th observation – value of 14th observation)
= 400 + 0.4(450 – 400)
= 400 + 0.4(50)
= 400 + 20
∴ P90 = 420
Question 3.
Calculate 2nd decile and 65th percentile for the following:
Solution:
We construct the less than cumulative frequency table as given below:
Here, n = 200
D2 = value of 2\(\left(\frac{n+1}{10}\right)^{\text {th }}\) observation
= value of 2\(\left(\frac{200+1}{10}\right)^{\text {th }}\) observation
= value of (2 × 20.1)th observation
= value of (40.2)th observation
Cumulative frequency which is just greater than (or equal to) 40.2 is 58.
∴ D2 = 120
P65 = value of 65\(\left(\frac{n+1}{100}\right)^{\text {th }}\) observation
= value of 65\(\left(\frac{200+1}{100}\right)^{\text {th }}\) observation
= value of (65 × 2.01)th observation
= value of (130.65)th observation
The cumulative frequency which is just greater than (or equal to) 130.65 is 150.
∴ P65 = 280
Question 4.
From the following data calculate the rent of the 15th, 65th, and 92nd house.
Solution:
Arranging the given data in ascending order.
Here, n = 100
P15 = value of 15
= value of 15\(\left(\frac{n+1}{100}\right)^{\text {th }}\) observation
= value of 15\(\left(\frac{100+1}{100}\right)^{\text {th }}\) observation
= value of (15 × 1.01 )th observation
= value of (15.15)th observation
Cumulative frequency which is just greater than (or equal to) 15.15 is 25.
∴ P15 = 11000
P65 = value of 65\(\left(\frac{n+1}{100}\right)^{\text {th }}\)observation
= value of 65\(\left(\frac{100+1}{100}\right)^{\text {th }}\) observation
= value of (65 × 1.01)th observation
= value of (65.65)th observation
Cumulative frequency which is just greater than (or equal to) 65.65 is 70.
∴ P65 = 14000
P92 = value of 92\(\left(\frac{n+1}{100}\right)^{\text {th }}\) observation
= value of 92\(\left(\frac{100+1}{100}\right)^{\text {th }}\) observation
= value of (92 × 1.01)th observation
= value of (92.92)th observation
Cumulative frequency which is just greater than (or equal to) 92.92 is 98.
∴ P92 = 17000
Question 5.
The following frequency distribution shows the weight of students in a class.
(a) Find the percentage of students whose weight is more than 50 kg.
(b) If the weight column provided is of mid values then find the percentage of students whose weight is more than 50 kg.
Solution:
(a) Let the percentage of students weighing less than 50 kg be x.
∴ Px = 50
From the table, out of 20 students, 84 students have their weight less than 50 kg.
∴ Number of students weighing more than 50 kg = 120 – 84 = 36
∴ Percentage of students having there weight more than 50 kg = \(\frac{36}{120}\) × 100 = 30%
(b) The difference between any two consecutive mid values of weight is 5 kg.
The class intervals must of width 5, with 40, 45,….. as their mid values.
∴ The class intervals will be 37.5 – 42.5, 42.5 – 47.5, etc.
We construct the less than cumulative frequency table as given below:
Here, N = 120
Let Px = 50
The value 50 lies in the class 47.5 – 52.5
∴ L = 47.5, h = 5, f = 29, c.f. = 55
∴ x = 58 (approximately)
∴ 58% of students are having weight below 50 kg.
∴ Percentage of students having weight above 50 kg is 100 – 58 = 42
∴ 42% of students are having weight above 50 kg.
Question 6.
Calculate D4 and P48 from the following data:
Solution:
The difference between any two consecutive mid values is 5, the width of class interval = 5
∴ Class interval with mid-value 2.5 is 0 – 5
Class interval with mid value 7.5 is 5 – 10, etc.
We construct the less than cumulative frequency table as given below:
Here, N = 100
D4 class = class containing \(\left(\frac{4 \mathrm{N}}{10}\right)^{\text {th }}\) observation
∴ \(\frac{4 \mathrm{N}}{10}=\frac{4 \times 100}{10}\) = 40
Cumulative frequency which is just greater than (or equal to) 40 is 50.
∴ D4 lies in the class 10 – 15.
∴ L = 10,h = 5, f = 25, c.f. = 25
∴ D4 = \(\mathrm{L}+\frac{\mathrm{h}}{\mathrm{f}}\left(\frac{4 \mathrm{~N}}{10}-\text { c.f. }\right)\)
= 10 + \(\frac{5}{25}\) (40 – 25)
= 10 + \(\frac{1}{5}\) (15)
= 10 + 3
∴ D4 = 13
P48 class = class containing \(\left(\frac{48 \mathrm{~N}}{100}\right)^{\text {th }}\) observation
∴ \(\frac{48 \mathrm{~N}}{100}=\frac{48 \times 100}{100}\) = 48
Cumulative frequency which is just greater than (or equal to) 48 is 50.
∴ P48 lies in the class 10 – 15.
∴ L = 10, h = 5, f = 25, c.f. = 25
∴ P48 = \(\mathrm{L}+\frac{\mathrm{h}}{\mathrm{f}}\left(\frac{48 \mathrm{~N}}{100}-\text { c.f. }\right)\)
= 10 + \(\frac{5}{25}\) (48 – 25)
= 10 + \(\frac{1}{5}\) (23)
= 10 + 4.6
∴ P48 = 14.6
Question 7.
Calculate D9 and P20 of the following distribution.
Solution:
We construct the less than cumulative frequency table as given below:
Here, N = 240
D9 class = class containing \(\left(\frac{9 \mathrm{~N}}{10}\right)^{\mathrm{th}}\) observation
∴ \(\frac{9 \mathrm{~N}}{10}=\frac{9 \times 240}{10}\) = 216
Cumulative frequency which is just greater than (or equal to) 216 is 225.
∴ D9 lies in the class 80 – 100.
∴ L = 80, h = 20, f = 90, c.f. = 135
∴ D9 = \(L+\frac{h}{f}\left(\frac{9 N}{10}-c . f .\right)\)
= 80 + \(\frac{20}{90}\)(216 – 135)
= 80 + \(\frac{2}{9}\)(81)
= 80 + 18
∴ D9 = 98
P20 class = class containing \(\left(\frac{20 \mathrm{~N}}{100}\right)^{\text {th }}\) observation
∴ \(\frac{20 \mathrm{~N}}{100}=\frac{20 \times 240}{100}\) = 48
Cumulative frequency which is just greater than (or equal to) 48 is 50.
∴ P20 lies in the class 40 – 60.
∴ L = 40, h = 20, f = 35, c.f. = 15
∴ P20 = 58.86
Question 8.
Weekly wages for a group of 100 persons are given below:
D3 for this group is ₹ 1100. Calculate the missing frequencies.
Solution:
Let a and b be the missing frequencies of class 500 – 1000 and class 2000 – 2500 respectively.
We construct the less than cumulative frequency table as given below:
Here, N = 62 + a + b
Since, N = 100
∴ 62 + a + b = 100
∴ a + b = 38 …..(i)
Given, D3 = 1100
∴ D3 lies in the class 1000 – 1500.
∴ L = 1000, h = 500, f = 25, c.f. = 7 + a
∴ \(\frac{3 \mathrm{~N}}{10}=\frac{3 \times 100}{10}=30\)
∴ D3 = \(\mathrm{L}+\frac{\mathrm{h}}{\mathrm{f}}\left(\frac{3 \mathrm{~N}}{10}-\mathrm{c} . \mathrm{f} .\right)\)
∴ 1100 = 1000 + \(\frac{500}{25}\) [30 – (7 + a)]
∴ 1100 – 1000 = 20(30 – 7 – a)
∴ 100 = 20(23 – a)
∴ 100 = 460 – 20a
∴ 20a = 460 – 100
∴ 20a = 360
∴ a = 18
Substituting the value of a in equation (i), we get
18 + b = 38
∴ b = 38 – 18 = 20
∴ 18 and 20 are the missing frequencies of the class 500 – 1000 and class 2000 – 2500 respectively.
Question 9.
The weekly profit (in rupees) of 100 shops are distributed as follows:
Find the limits of the profit of middle 60% of the shops.
Solution:
To find the limits of the profit of the middle 60% of the shops, we have to find P20 and P80.
We construct the less than cumulative frequency table as given below:
Here, N = 100
P20 class = class containing \(\left(\frac{20 \mathrm{N}}{100}\right)^{\text {th }}\) observation
∴ \(\frac{20 \mathrm{N}}{100}=\frac{20 \times 100}{100}=20\)
Cumulative frequency which is just greater than (or equal to) 20 is 26.
∴ P20 lies in the class 1000 – 2000.
∴ L = 1000, h = 1000, f = 16, c.f. = 10
∴ P20 = \(L+\frac{h}{f}\left(\frac{20 \mathrm{~N}}{100}-\text { c.f. }\right)\)
= 1000 + \(\frac{1000}{16}\) (20 – 10)
= 1000 + \(\frac{125}{2}\) (10)
= 1000 + 625
∴ P20 = 1625
P80 class = class containing \(\left(\frac{80 \mathrm{~N}}{100}\right)^{\text {th }}\) observation
∴ \(\frac{80 \mathrm{~N}}{100}=\frac{80 \times 100}{100}=80\)
Cumulative frequency which is just greater than (or equal to) 80 is 92.
∴ P80 lies in the class 4000 – 5000.
∴ L = 4000, h = 1000, f = 20, c.f. = 72
∴ P80 = \(L+\frac{h}{f}\left(\frac{80 \mathrm{~N}}{100}-\text { c.f. }\right)\)
= 4000 + \(\frac{1000}{20}\)(80 – 72)
= 4000 + 50(8)
= 4000 + 400
∴ P80 = 4400
∴ the profit of middle 60% of the shops lie between the limits ₹ 1,625 to ₹ 4,400.
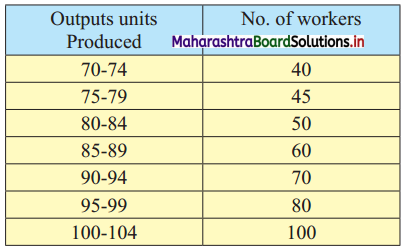
Question 10.
In a particular factory, workers produce various types of output units. The following distribution was obtained:
Find the percentage of workers who have produced less than 82 output units.
Solution:
Since the given data is not continuous, we have to convert it into a continuous form by subtracting 0.5 from the lower limit and adding 0.5 to the upper limit of every class interval.
∴ the class intervals will be 69.5 – 74.5, 74.5 – 79.5, etc.
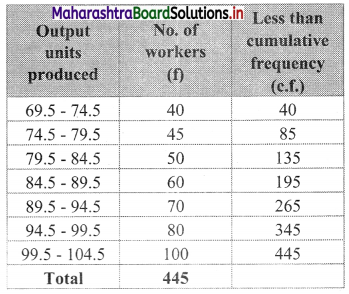
We construct the less than cumulative frequency table as given below:
Here, N = 445
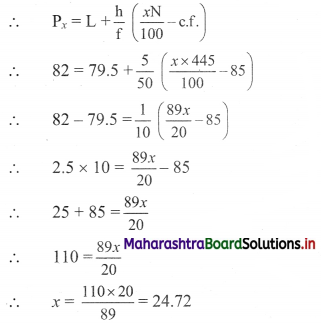
Let Px = 82
The value 82 lies in the class 79.5 – 84.5
∴ L = 79.5, h = 5, f = 50, c.f. = 85
∴ 24.72% of workers produced less than 82 output units.