Balbharti Maharashtra State Board Class 11 Geography Solutions
Chapter 5 Global Climate Change Textbook Exercise Questions and Answers.
1. Complete the chain.
Question 1.
Answer:

2. Identify the incorrect factor.
Question 1.
The causes of global warming-
(a) Emission of greenhouse gases
(b) Deforestation
(c) Apparent movement of the sun
(d) Industrialization
Answer:
(c) Apparent movement of the sun
Question 2.
The indicators of climate change-
(a) Retreat of glaciers
(b) Increase in the frequency of floods
(c) Increase in frequency of cyclones
(d) Increase in the minimum and maximum temperature
Answer:
(d) Increase in the minimum and maximum temperature
Question 3.
The tools for studying climate change
(a) Ice cores
(b) Coral reef
(c) Tree rings
(d) Ancient forts
Answer:
(d) Ancient forts
Question 4.
Measures to combat climate change –
(a) Banning the use of pesticides and insecticides
(b) Promoting afforestation and banning deforestation
(c) Banning public transport
(d) Banning fossil fuels
Answer:
(c) Banning public transport
3. Give geographical reasons.
Question 1.
It is important to study climate change.
Answer:
It is important to study climate change because –
Question 2.
There is a great possibility that we may not see Maldives on the world map in the future.
Answer:
There is a great possibility that we may not see Maldives on the world map in the future because-
Question 3.
The snowline is retreating.
Answer:
The snowline is retreating because –
Question 4.
There is an increase in the frequency of droughts and cyclones.
Answer:
There is an increase in the frequency of droughts and cyclones because-
4. Write short notes on.
Question 1.
Bleaching of coral reefs
Answer:
Question 2.
Flash floods
Answer:
Question 3.
Tools to study Paleoclimatology
Answer:
Paleoclimatology is the study of the weather and climate of the earth’s past. Scientists and meteorologists have been using instruments to measure climate and weather for the past 140 years. However, millions of years ago historical evidence called proxy data, which includes coral reefs, tree rings, ice cores, etc., were used to tell about the climate.
Coral reefs:
Tree rings:
Ice cores:
Question 4.
Greenhouse gases
Answer:
5. Answer in detail.
Question 1.
Climate change has not always been anthropogenic in nature. Explain.
Answer:
Though the human activities are a major cause behind climate change, there are some natural causes for climate change. They are as follows:
Amount of energy output by the sun:
Milankovitch Oscillation:
Volcanism:
Goldilocks Zone:
Question 2.
What measures will you suggest to combat climate change in your village/city.
Answer:
Following measures can be taken to combat climate change in our village / city.
11th Geography Digest Chapter 5 Global Climate Change Intext Questions and Answers
Can you tell? (Textbook Page No. 58)
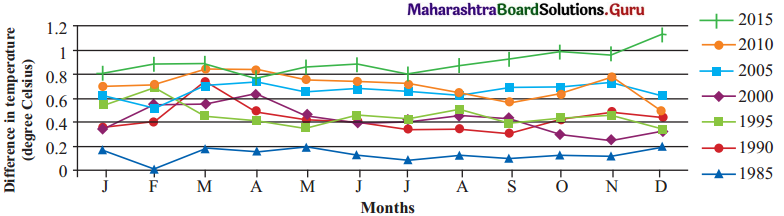
1. The graph in the figure shows the difference between the global average temperature of the twentieth century and global monthly temperatures from 1985 to 2015. Answer the questions given below.
Question 1.
In which year is the difference the least?
Ans.
Difference in the temperature is least in the year 1985.
Question 2.
What is the difference between the mean temperatures of the twentieth century and temperature in 2015?
Answer:
The difference between the mean temperature of twentieth century (1995-2000) and 2015 is 0.8°C.
Question 3.
Why do the temperatures differ in different months?
Answer:
The temperature differs in different months because of the occurrence of different seasons.
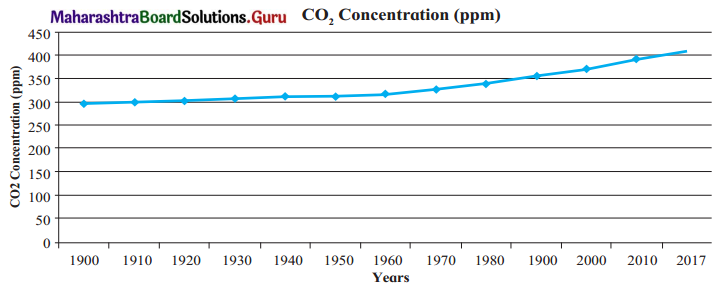
2. Look at the graph and answer the questions. (Textbook Page No. 63)
Question 1.
What does this graph show?
Ans.
The graph shows CO2 concentration (ppm) and its increased level over the period of time from 1900 to 2017.
Question 2.
What does ppm mean?
Answer:
The abbreviation ppm means ‘parts per million’ of carbon concentration in the atmosphere.
Question 3.
Since which year has the increase been phenomenal?
Answer:
After 1980, there has been a phenomenal increase observed.
Question 4.
Can you think of the reasons behind the increase in carbon dioxide?
Answer:
The reasons behind the increase in carbon dioxide is due to combustion of fossil fuels and large- scale deforestation.
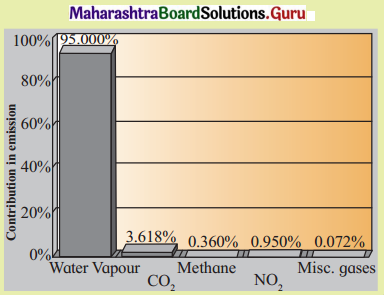
Try this. (Textbook Page No. 59)
1. Look at the following graph. Answer the following question.
Question 1.
Which of these gases has the highest contribution?
Answer:
Water vapour, shows the highest contribution.
Question 2.
Which of these gases came from natural and man-made sources?
Answer:
Water vapour, methane, NO2 and miscellaneous gases are naturally occurring gases while CO2 is man-made.
Question 3.
Which activities are responsible for their emission?
Answer:
Burning of fossil fuels like coal, etc., and deforestation are responsible for emission of CO2.
Question 4.
Out of these, whose emission can be controlled by humans?
Ans.
The emission of CO2 can be controlled by humans.
Question 2.
Make a list of things you need to change in your lifestyle. (Textbook Page No. 67)
Answer:
Find out! (Textbook Page No. 62)
Question 1.
Use internet and reference books on climate change and make a list of species vulnerable to climate change.
Answer:
Species vulnerable to climate change are: corals, polar bear and frogs.
Question 2.
Make a list of movies based on ice age and climate change. (Textbook Page No. 65)
Answer:
Question 3.
With the help of internet, find out the details of the National Action Plan on Climate Change (NAPCC), 2008 and its missions. (Textbook Page No. 66)
Answer:
NAPCC is a government document that includes eight ambitious goals set for the country to achieve.
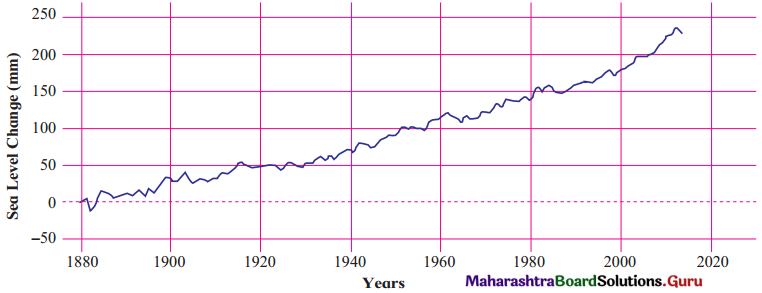
1. Look at the graph and answer the following questions. (Textbook Page No. 60)
Question 1.
What does the graph show?
Answer:
The graph shows an increase in the global sea level from 1880 till date.
Question 2.
In which year is the change around 225 mm?
Answer:
The change around 225 mm is observed is the year 2018.
Question 3.
What conclusions can you draw by seeing the graph?
Answer:
With the continued global warming the sea levels are likely to rise.
Question 4.
What correlation can be seen in this graph and the graph of rising temperature?
Answer:
With the rising temperature the sea level is rising. We can conclude this from both the graphs.
Question 2.
Compare both the satellite images in fig 5.3 (A) and (B). (Textbook Page No. 61)
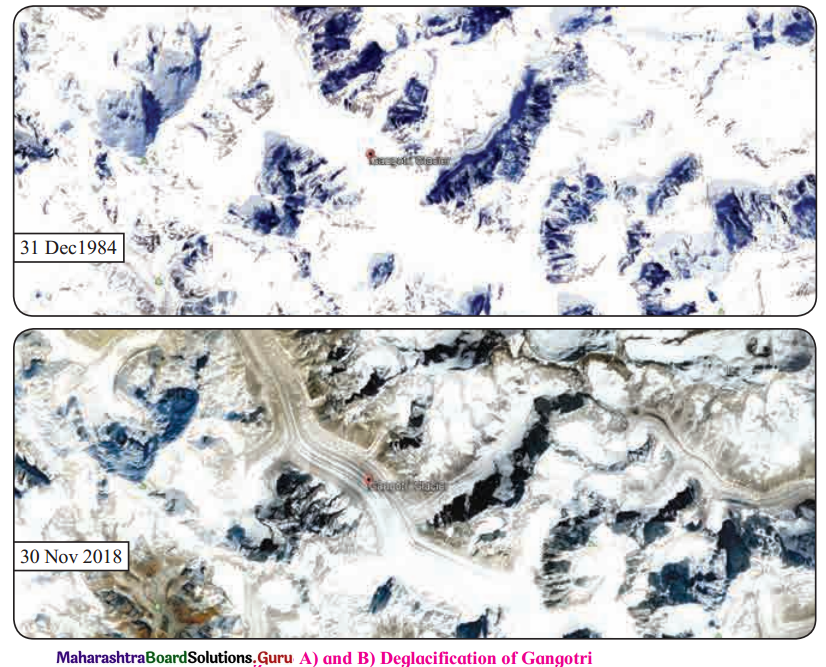
Answer:
Fig. 5.3 (A) shows the snow-covered Gangotri glacier area in Dec. 1984, whereas in Fig. 5.3 (B) the snow-covered region of the Gangotri glacier has retreated by 2018.
Chapter 5 Global Climate Change Textbook Exercise Questions and Answers.
1. Complete the chain.
Question 1.
| A | B | C |
| (1) Melting of snow | (1) Increase in sea level | (1) Flooding |
| (2) Effects of insolation | (2) Erratic rains | (2) Increase in frequency of cyclones |
| (3) Greenhouse gases | (3) Methane | (3) Agriculture |
| (4) Climate change | (4) Average temperature of the earth | (4) Existence of life on Earth |
| A | B | C |
| (1) Melting of snow | (1) Methane | (1) Flooding |
| (2) Effects of insolation | (2) Average temperature of the earth | (2) Agriculture |
| (3) Greenhouse gases | (3) Erratic rains | (3) Existence of life on Earth |
| (4) Climate change | (4) Increase in sea level | (4) Increase in frequency on cyclones |
2. Identify the incorrect factor.
Question 1.
The causes of global warming-
(a) Emission of greenhouse gases
(b) Deforestation
(c) Apparent movement of the sun
(d) Industrialization
Answer:
(c) Apparent movement of the sun
Question 2.
The indicators of climate change-
(a) Retreat of glaciers
(b) Increase in the frequency of floods
(c) Increase in frequency of cyclones
(d) Increase in the minimum and maximum temperature
Answer:
(d) Increase in the minimum and maximum temperature
Question 3.
The tools for studying climate change
(a) Ice cores
(b) Coral reef
(c) Tree rings
(d) Ancient forts
Answer:
(d) Ancient forts
Question 4.
Measures to combat climate change –
(a) Banning the use of pesticides and insecticides
(b) Promoting afforestation and banning deforestation
(c) Banning public transport
(d) Banning fossil fuels
Answer:
(c) Banning public transport
3. Give geographical reasons.
Question 1.
It is important to study climate change.
Answer:
It is important to study climate change because –
Question 2.
There is a great possibility that we may not see Maldives on the world map in the future.
Answer:
There is a great possibility that we may not see Maldives on the world map in the future because-
Question 3.
The snowline is retreating.
Answer:
The snowline is retreating because –
Question 4.
There is an increase in the frequency of droughts and cyclones.
Answer:
There is an increase in the frequency of droughts and cyclones because-
4. Write short notes on.
Question 1.
Bleaching of coral reefs
Answer:
Question 2.
Flash floods
Answer:
Question 3.
Tools to study Paleoclimatology
Answer:
Paleoclimatology is the study of the weather and climate of the earth’s past. Scientists and meteorologists have been using instruments to measure climate and weather for the past 140 years. However, millions of years ago historical evidence called proxy data, which includes coral reefs, tree rings, ice cores, etc., were used to tell about the climate.
Coral reefs:
Tree rings:
Ice cores:
Question 4.
Greenhouse gases
Answer:
5. Answer in detail.
Question 1.
Climate change has not always been anthropogenic in nature. Explain.
Answer:
Though the human activities are a major cause behind climate change, there are some natural causes for climate change. They are as follows:
Amount of energy output by the sun:
Milankovitch Oscillation:
Volcanism:
Goldilocks Zone:
Question 2.
What measures will you suggest to combat climate change in your village/city.
Answer:
Following measures can be taken to combat climate change in our village / city.
11th Geography Digest Chapter 5 Global Climate Change Intext Questions and Answers
Can you tell? (Textbook Page No. 58)
1. The graph in the figure shows the difference between the global average temperature of the twentieth century and global monthly temperatures from 1985 to 2015. Answer the questions given below.
Question 1.
In which year is the difference the least?
Ans.
Difference in the temperature is least in the year 1985.
Question 2.
What is the difference between the mean temperatures of the twentieth century and temperature in 2015?
Answer:
The difference between the mean temperature of twentieth century (1995-2000) and 2015 is 0.8°C.
Question 3.
Why do the temperatures differ in different months?
Answer:
The temperature differs in different months because of the occurrence of different seasons.
2. Look at the graph and answer the questions. (Textbook Page No. 63)
Question 1.
What does this graph show?
Ans.
The graph shows CO2 concentration (ppm) and its increased level over the period of time from 1900 to 2017.
Question 2.
What does ppm mean?
Answer:
The abbreviation ppm means ‘parts per million’ of carbon concentration in the atmosphere.
Question 3.
Since which year has the increase been phenomenal?
Answer:
After 1980, there has been a phenomenal increase observed.
Question 4.
Can you think of the reasons behind the increase in carbon dioxide?
Answer:
The reasons behind the increase in carbon dioxide is due to combustion of fossil fuels and large- scale deforestation.
Try this. (Textbook Page No. 59)
1. Look at the following graph. Answer the following question.
Question 1.
Which of these gases has the highest contribution?
Answer:
Water vapour, shows the highest contribution.
Question 2.
Which of these gases came from natural and man-made sources?
Answer:
Water vapour, methane, NO2 and miscellaneous gases are naturally occurring gases while CO2 is man-made.
Question 3.
Which activities are responsible for their emission?
Answer:
Burning of fossil fuels like coal, etc., and deforestation are responsible for emission of CO2.
Question 4.
Out of these, whose emission can be controlled by humans?
Ans.
The emission of CO2 can be controlled by humans.
Question 2.
Make a list of things you need to change in your lifestyle. (Textbook Page No. 67)
Answer:
Find out! (Textbook Page No. 62)
Question 1.
Use internet and reference books on climate change and make a list of species vulnerable to climate change.
Answer:
Species vulnerable to climate change are: corals, polar bear and frogs.
Question 2.
Make a list of movies based on ice age and climate change. (Textbook Page No. 65)
Answer:
Question 3.
With the help of internet, find out the details of the National Action Plan on Climate Change (NAPCC), 2008 and its missions. (Textbook Page No. 66)
Answer:
NAPCC is a government document that includes eight ambitious goals set for the country to achieve.
1. Look at the graph and answer the following questions. (Textbook Page No. 60)
Question 1.
What does the graph show?
Answer:
The graph shows an increase in the global sea level from 1880 till date.
Question 2.
In which year is the change around 225 mm?
Answer:
The change around 225 mm is observed is the year 2018.
Question 3.
What conclusions can you draw by seeing the graph?
Answer:
With the continued global warming the sea levels are likely to rise.
Question 4.
What correlation can be seen in this graph and the graph of rising temperature?
Answer:
With the rising temperature the sea level is rising. We can conclude this from both the graphs.
Question 2.
Compare both the satellite images in fig 5.3 (A) and (B). (Textbook Page No. 61)
Answer:
Fig. 5.3 (A) shows the snow-covered Gangotri glacier area in Dec. 1984, whereas in Fig. 5.3 (B) the snow-covered region of the Gangotri glacier has retreated by 2018.