Balbharti Maharashtra State Board Class 6 Maths Solutions covers the Std 6 Maths Chapter 6 Bar Graphs Class 6 Practice Set 19 Answers Solutions.
Bar Graphs Class 6 Maths Chapter 6 Practice Set 19 Solutions Maharashtra Board
Std 19 Maths Practice Set 18 Solutions Answers
Question 1.
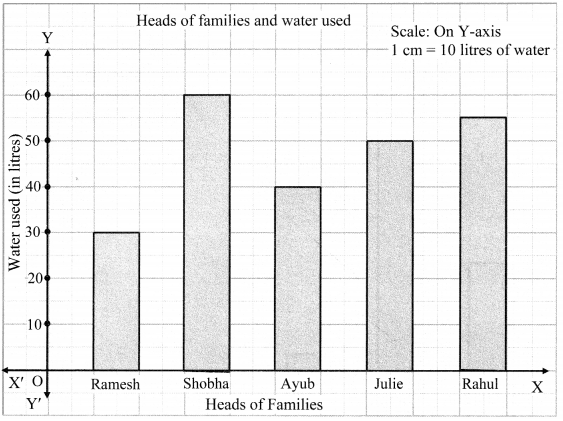
The names of the heads of some families in a village and the quantity of drinking water their family consumes in one day are given below. Draw a bar graph for this data.
(Scale: On Y axis. 1 cm = 10 liters of water)
| Name | Ramesh | Shobha | Ayub | Julie | Rahul |
| Liters of water Used | 30 L | 60 L | 40 L | 50L | 55 L |
Solution:
Question 2.
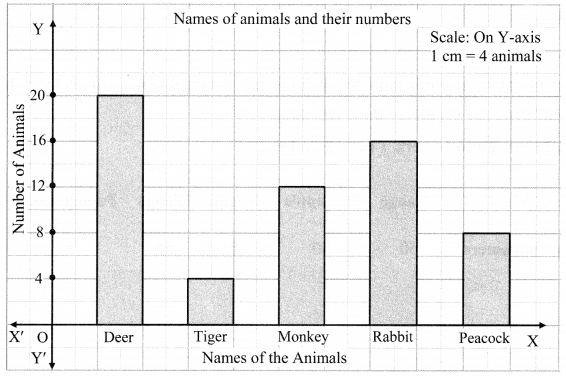
The names and numbers of animals in a certain zoo are given below. Use the data to make a bar graph. (Scale: On Y axis, 1 cm = 4 animals).
| Animals | Deer | Tiger | Monkey | Rabbit | Peacock |
| Number | 20 | 4 | 12 | 16 | 8 |
Solution:
Question 3.
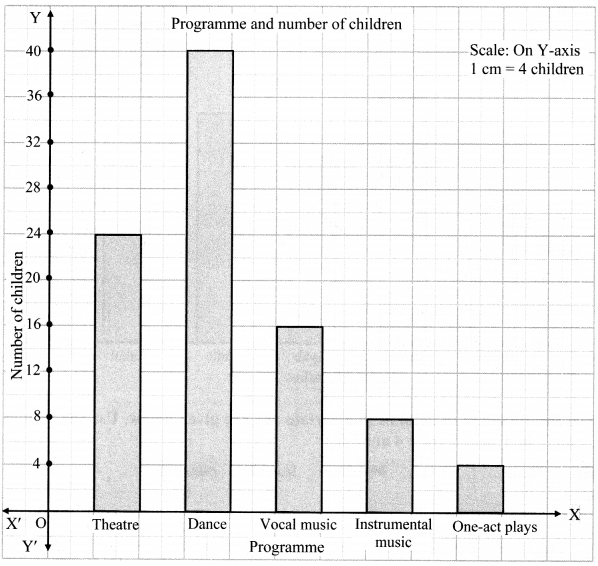
The table below gives the number of children who took part in the various items of the talent show as part of the annual school gathering. Make a bar graph to show this data.
(Scale: On Y-axis, 1 cm = 4 children)
| Programme | Theater | Dance | Vocal music | Instrumental music | One-act plays |
| Number of Children | 24 | 40 | 16 | 8 | 4 |
Solution:
Question 4.
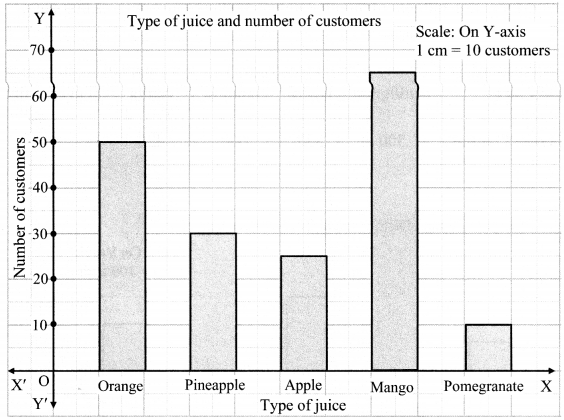
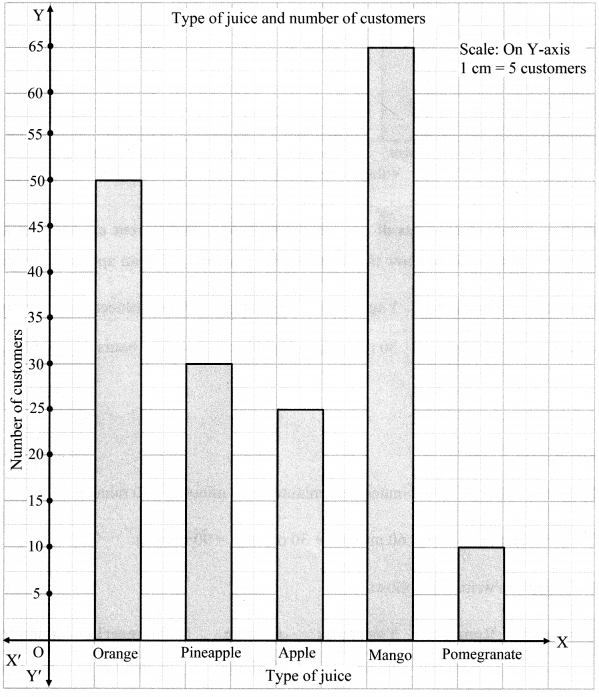
The number of customers who came to a juice centre during one week is given in the table below. Make two different bar graphs to show this data.
(On Y-axis, 1 cm = 10 customers, 1 cm = 5 customers)
| Type of juice | Orange | Pineapple | Apple | Mango | Pomegranate |
| Number of customers | 50 | 30 | 25 | 65 | 10 |
Solution:
Question 5.
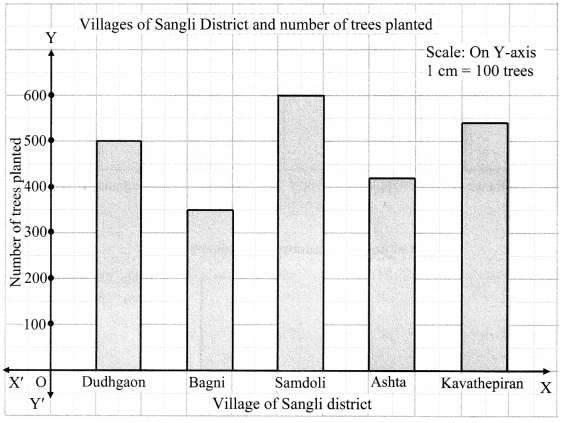
Students planted trees in 5 villages of Sangli district. Make a bar graph of this data. (Scale: On Y-axis, 1 cm = 100 trees).
| Name of Place | Dudhgaon | Bagni | Samdoli | Ashta | Kavathepiran |
| Number of Trees Planted | 500 | 350 | 600 | 420 | 540 |
Solution:
Question 6.
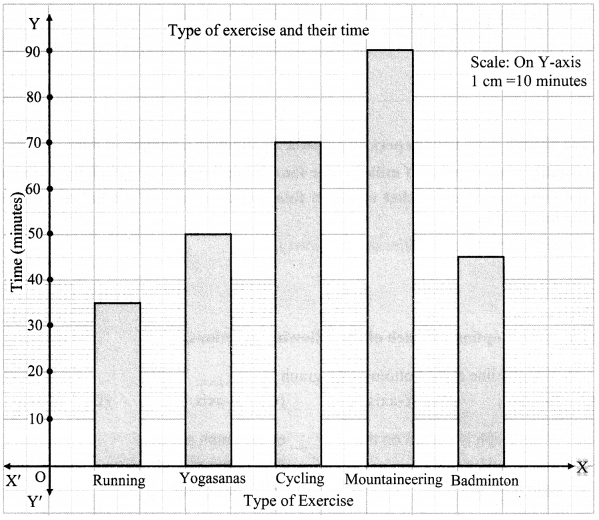
Yashwant gives different amounts of time as shown below, to different exercises he does during the week. Draw a bar graph to show the details of his schedule using an appropriate scale.
| Type of exercise | Running | Yogasanas | Cycling | Mountaineering | Badminton |
| Time | 35 minutes | 50 minutes | 1 hr 10 min | \(1\frac { 1 }{ 2 }\) hours | 45 minutes |
Solution:
1 hour = 60 minutes
∴ 1 hour 10 minutes = 1 hour + 10 minutes = 60 minutes +10 minutes = 70 minutes
and \(1\frac { 1 }{ 2 }\) hours = 1 hour + \(\frac { 1 }{ 2 }\) hour = 60 minutes + 30 minutes = 90 minutes
The given table can be written as follows:
| Type of Exercise | Running | Yogasanas | Cycling | Moutaineering | Badminton |
| Time | 35 minutes | 50 minutes | 70 minutes | 90 minutes | 45 minutes |
Question 7.
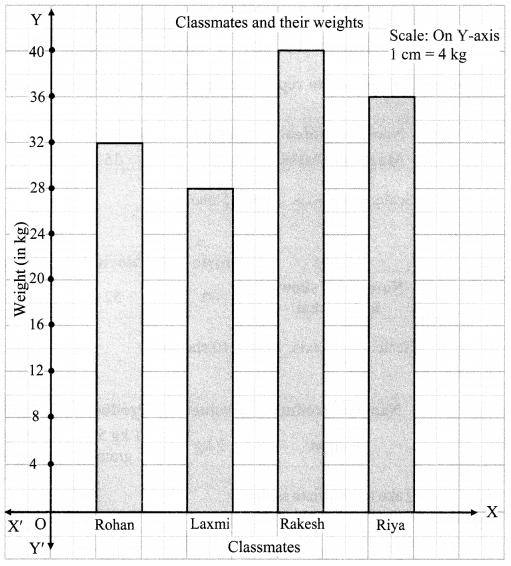
Write the names of four of your classmates. Beside each name, write his/her weight in kilograms. Enter this data in a table like the above and make a bar graph.
Solution:
| Name of classmates | Weight (kg) |
| Rohan | 32 |
| Laxmi | 28 |
| Rakesh | 40 |
| Riya | 36 |
Scale: On Y-axis, 1 cm = 4 kg [Note: Students can take their own examples]
Maharashtra Board Class 6 Maths Chapter 6 Bar Graphs Practice Set 19 Intext Questions and Activities
Question 1.
Collect bar graphs from newspapers or periodicals showing a variety of data. (Textbook pg. no. 38)
Solution:
(Student should attempt the activities on their own.)