Balbharti Maharashtra State Board Class 7 Maths Solutions covers the 7th Std Maths Practice Set 31 Answers Solutions Chapter 7 Joint Bar Graph.
Joint Bar Graph Class 7 Maths Chapter 7 Practice Set 31 Solutions Maharashtra Board
Std 7 Maths Practice Set 31 Solutions Answers
Question 1.
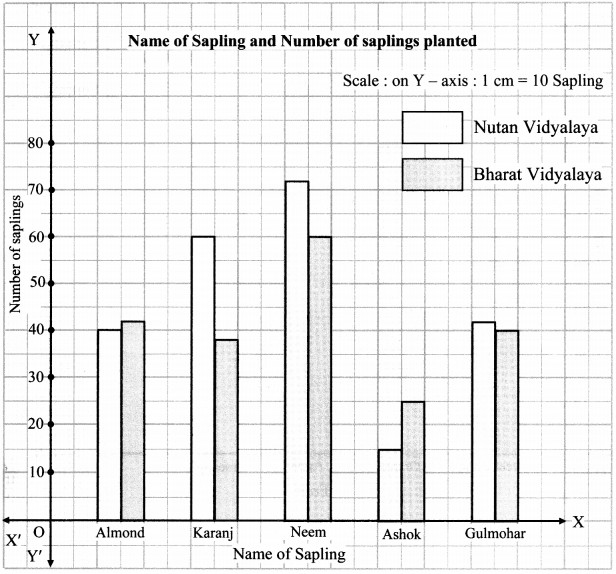
The number of saplings planted by schools on World Tree Day is given in the table below. Draw a joint bar graph to show these figures.
| School Name\Name of Sapling | Almond | Karanj | Neem | Ashok | Gulmohar |
| Nutan Vidyalaya | 40 | 60 | 72 | 15 | 42 |
| Bharat Vidyalaya | 42 | 38 | 60 | 25 | 40 |
Solution:
Question 2.
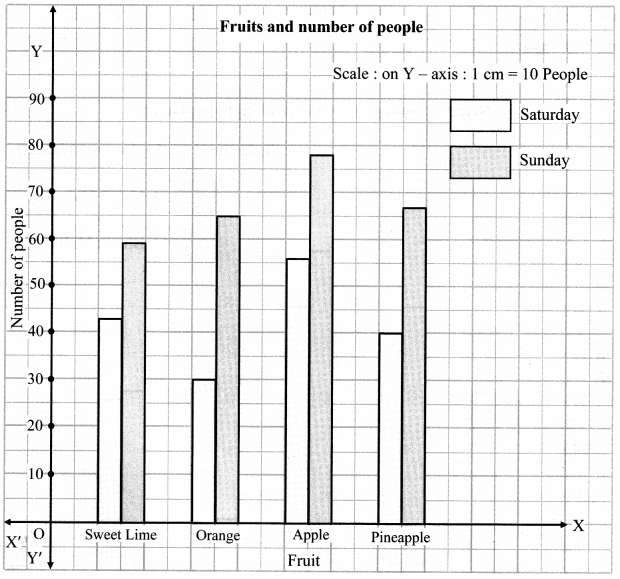
The table below shows the number of people who had the different juices at a juice bar on a Saturday and a Sunday. Draw a joint bar graph for this data.
| Days\Fruits | Sweet Lime | Orange | Apple | Pineapple |
| Saturday | 43 | 30 | 56 | 40 |
| Sunday | 59 | 65 | 78 | 67 |
Solution:
Question 3.
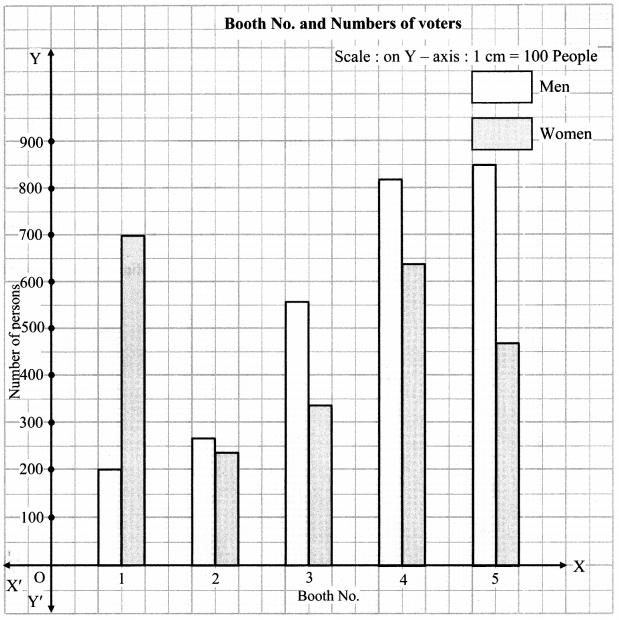
The following numbers of votes were cast at 5 polling booths during the Gram Panchayat elections. Draw a joint bar graph for this data.
| Persons\Booth No. | 1 | 2 | 3 | 4 | 5 |
| Men | 200 | 270 | 560 | 820 | 850 |
| Women | 700 | 240 | 340 | 640 | 470 |
Solution:
Question 4.
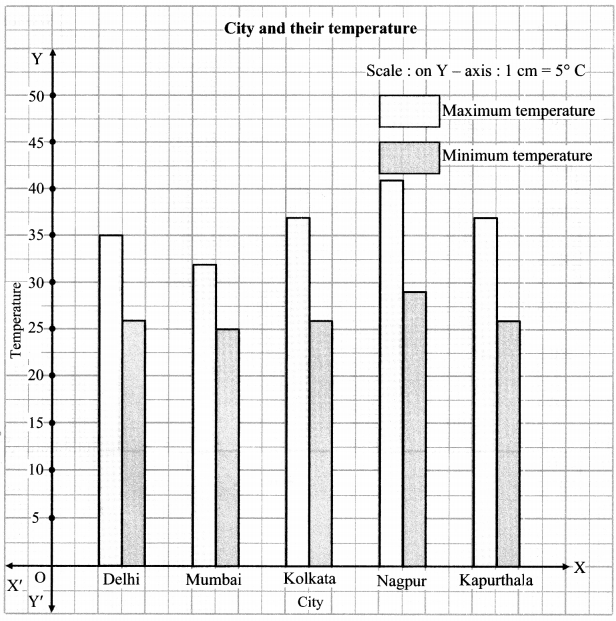
The maximum and minimum temperatures of five Indian cities are given in °C. Draw a joint bar graph for this data.
| City\Temperature | Delhi | Mumbai | Kolkata | Nagpur | Kapurthala |
| Maximum temperature | 35 | 32 | 37 | 41 | 37 |
| Minimum temperature | 26 | 25 | 26 | 29 | 26 |
Solution:
Question 5.
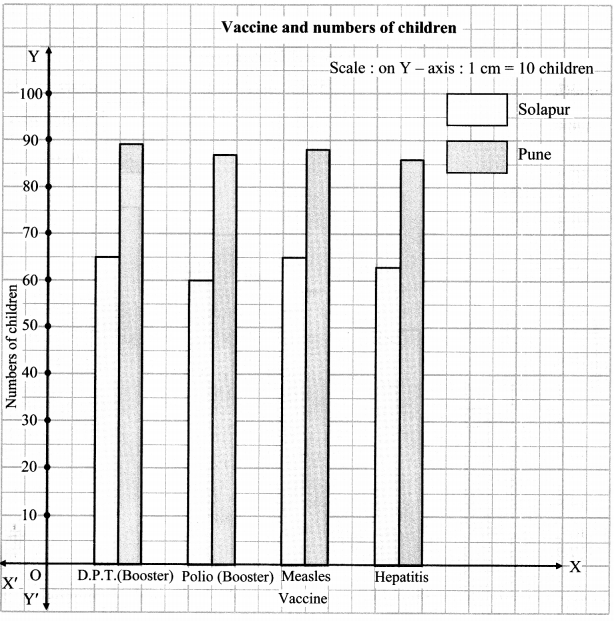
The numbers of children vaccinated in one day at the government hospitals in Solapur and Pune are given in the table. Draw a joint bar graph for this data:
| City\Vaccine | D.P.T. (Booster) | Polio (Booster) | Measles | Hepatitis |
| Solapur | 65 | 60 | 65 | 63 |
| Pune | 89 | 87 | 88 | 86 |
Solution:
Question 6.
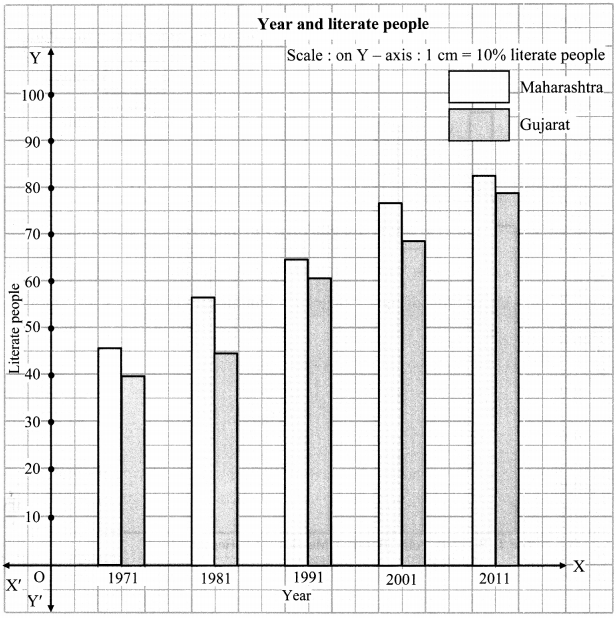
The percentage of literate people in the states of Maharashtra and Gujarat are given below. Draw a joint bar graph for this data.
| State\Year | 1971 | 1981 | 1991 | 2001 | 2011 |
| Maharashtra | 46 | 57 | 65 | 77 | 83 |
| Gujarat | 40 | 45 | 61 | 69 | 79 |
Solution:
Maharashtra Board Class 7 Maths Chapter 7 Joint Bar Graph Practice Set 31 Intext Questions and Activities
Question 1.
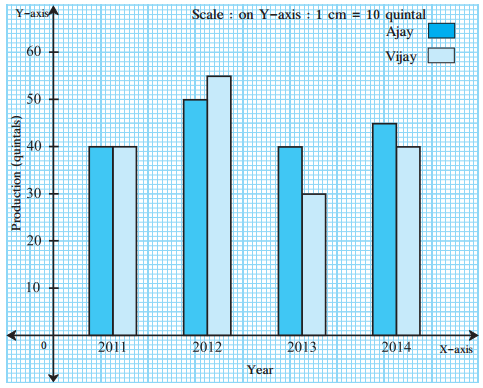
Observe the graph shown below and answer the following questions. (Textbook pg. no. 51)
- In which year did Ajay and Vijay both produce equal quantities of wheat?
- In year 2014, who produced more wheat?
- In year 2013, how much wheat did Ajay and Vijay each produce?
Solution:
- Both produced equal quantities of wheat in the year 2011.
- Ajay produced more wheat in the year 2014.
-
Ajay’s wheat production in 2013 = 40 quintal.
Vijay’s wheat production in 2013 = 30 quintal.
Question 2.
The minimum and maximum temperature in Pune for five days is given. Read the joint bar graph and answer the questions below: (Textbook pg. no. 52)
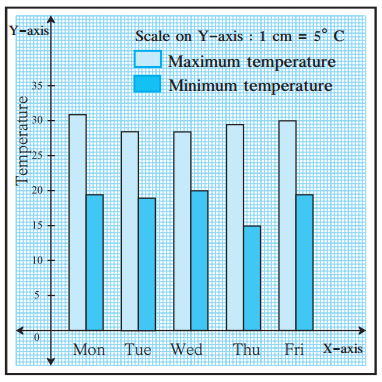
- What data is shown on X- axis?
- What data is shown on Y- axis?
- Which day had the highest temperature?
- On which day is the minimum temperature the highest?
- On Thursday, what is the difference between the minimum and maximum temperature?
- On which day is the difference between the minimum and maximum temperature the greatest?
Solution:
- Five days of a week are shown on X – axis.
- Temperature in the city of Pune is shown on Y – axis.
- Monday had the highest temperature.
- The minimum temperature was highest on Wednesday.
-
Maximum temperature = 29.5° C
Minimum temperature = 15° C
∴ Difference in temperature = 29.5° C – 15° C = 14.5 ° C - The difference in minimum and maximum temperature is greatest on Thursday.
Question 3.
Collect various kinds of graphs from newspapers and discuss them. (Textbook pg. no. 53)
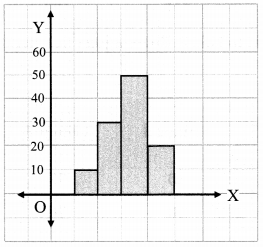
i. Histogram
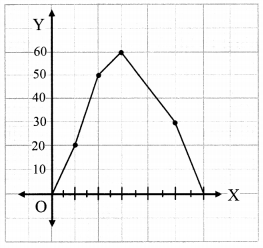
ii. Line graph
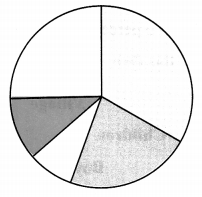
iii. Pie chart
Solution:
(Students should attempt the above activities on their own.)