Balbharti Maharashtra State Board Class 9 Maths Solutions covers the Practice Set 7.1 Algebra 9th Class Maths Part 1 Answers Solutions Chapter 7 Statistics.
9th Standard Maths 1 Practice Set 7.1 Chapter 7 Statistics Textbook Answers Maharashtra Board
Class 9 Maths Part 1 Practice Set 7.1 Chapter 7 Statistics Questions With Answers Maharashtra Board
Question 1.
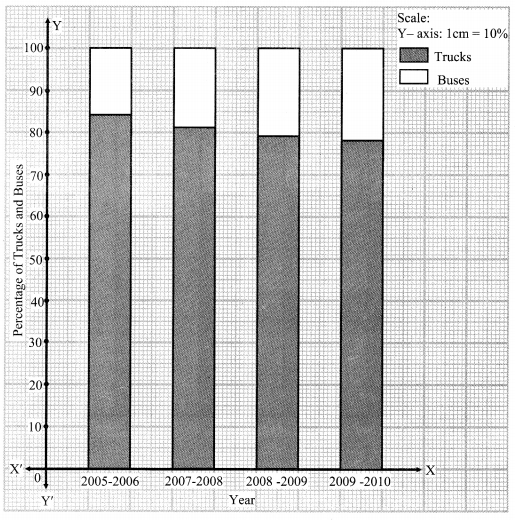
The following table shows the number of Buses and Trucks in nearest lakh units. Draw percentage bar diagram. (Approximate the percentages to the nearest integer)

Solution:

Question 2.
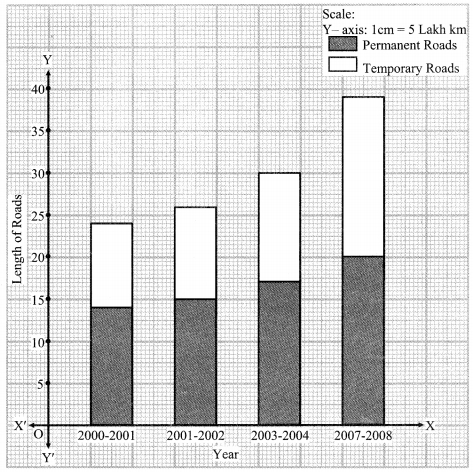
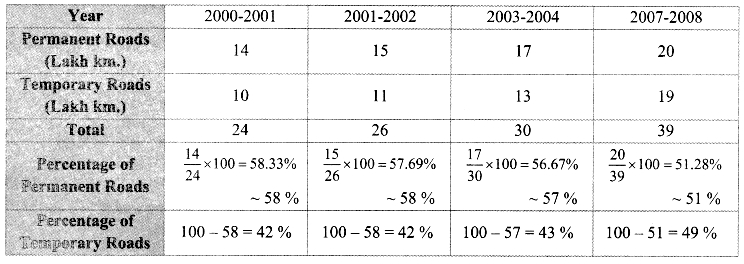
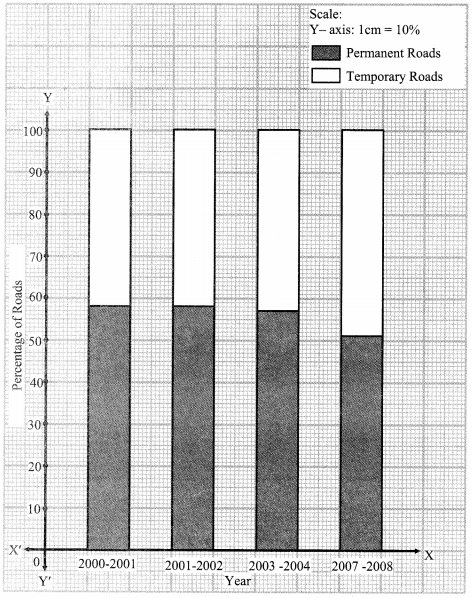
In the table given below, the information is given about roads. Using this draw sub-divided and percentage bar diagram (Approximate the percentages to the nearest integer)

Solution:
i. Sub-divided bar diagram:

ii. Percentage bar diagram:
Maharashtra Board Class 9 Maths Chapter 7 Statistics Practice Set 7.1 Intext Questions and Activities
Question 1.
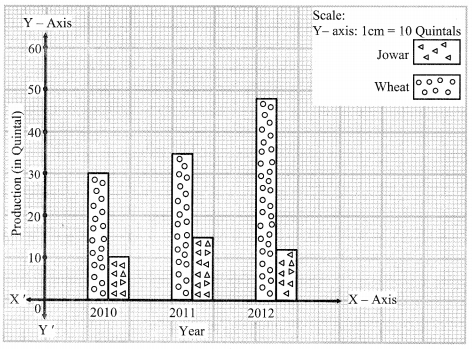
A farmer has produced Wheat and Jowar in his field. The following joint bar diagram shows the production of Wheat and Jowar. From the gken diagram answer the following questions: (Textbook pg. no. 108)
i. Which crop production has increased consistently in 3 years?
ii. By how many quintals the production ofjowar has reduced in 2012 as compared to 2011?
iii. What is the difference between the production of wheat in 2010 and 2012 ?
iv. Complete the following table using this diagram.

Solution:
i. The crop production of wheat has increased consistently in 3 years.
ii. The production of jowar has reduced by 3 quintals in 2012 as compared to 2011.
iii. The difference between the production of wheat in 2010 and 2012 = 48 – 30 = 18 quintals
iv.

Question 2.
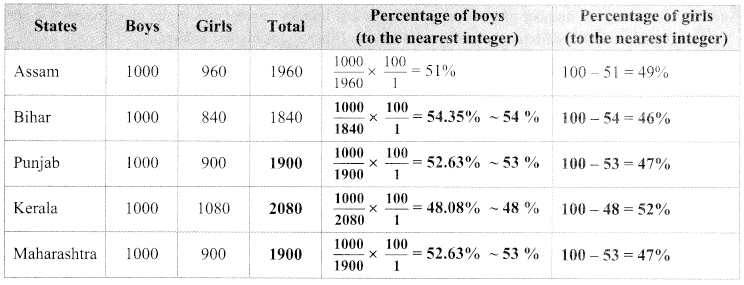
In the following table, the information of number of girls per 1000 boys is given for different states. Fill In the blanks and complete the table. (Textbook pg. no. 111)
Solution:
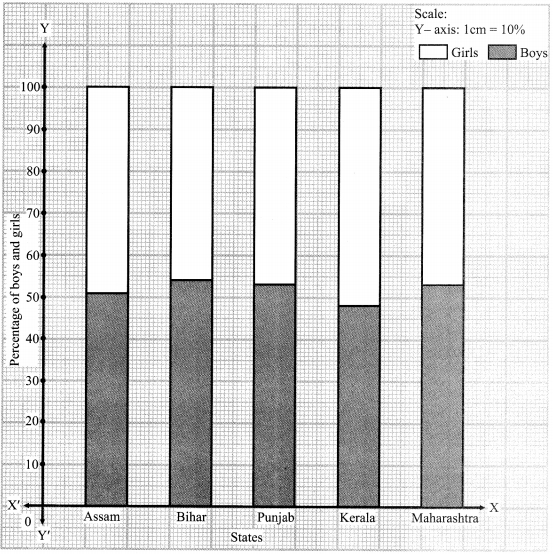
Draw percentage bar diagram from this information and discuss the findings from the diagram.
Question 3.
For the above given activity, the information of number of girls per 1000 boys is given for five states. The literacy percentage of these five states is given below. Assam (73%), Bihar (64%), Punjab (77%), Kerala (94%), Maharashtra (83%). Think of the number of girls and the literacy percentages in the respective states. Can you draw any conclusions from it? (Textbook pg. no. 112)
Solution:
By observing the number of girls per 1000 boys and literacy percentages in the given respective states, we can conclude that the literacy rate of girls is least in Bihar and is highest in Kerala.