Measures of Dispersion Class 11 Commerce Maths 2 Chapter 2 Miscellaneous Exercise 2 Answers Maharashtra Board
Balbharati Maharashtra State Board 11th Commerce Maths Solution Book Pdf Chapter 2 Measures of Dispersion Miscellaneous Exercise 2 Questions and Answers.
Std 11 Maths 2 Miscellaneous Exercise 2 Solutions Commerce Maths
Question 1.
Find the range for the following data.
116, 124, 164, 150, 149, 114, 195, 128, 138, 203, 144
Solution:
Here, largest value (L) = 203, smallest value (S) = 114
∴ Range = L – S
= 203 – 114
= 89
Question 2.
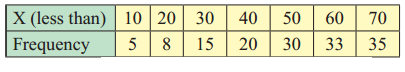
Given below the frequency distribution of weekly w ages of 400 workers. Find the range.
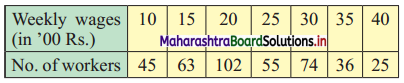
Solution:
Here, largest value (L) = 40, smallest value (S) = 10
∴ Range = L – S
= 40 – 10
= 30

Question 3.
Find the range of the following data.
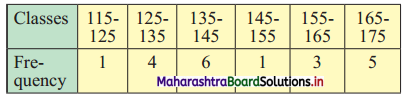
Solution:
Here, upper limit of the highest class (L) = 175, lower limit of the lowest class (S) = 115
∴ Range = L – S
= 175 – 115
= 60
Question 4.
The city traffic police issued challans for not observing the traffic rules:
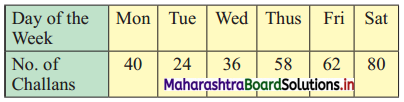
Find Q.D.
Solution:
The given data can be arranged in ascending order as follows:
24, 36, 40, 58, 62, 80
Here, n = 6
Q
1
= value of \(\left(\frac{n+1}{4}\right)^{\text {th }}\) observation
= value of \(\left(\frac{6+1}{4}\right)^{\text {th }}\) observation
= value of (1.75)th observation
= value of 1st observation + 0.75(value of 2nd observation – value of 1st observation)
= 24 + 0.75(36 – 24)
= 24 + 0.75(12)
= 24 + 9
∴ Q
1
= 33
Q
3
= value of 3\(\left(\frac{n+1}{4}\right)^{\text {th }}\) observation
= value of 3\(\left(\frac{6+1}{4}\right)^{\text {th }}\) observation
= value of (3 × 1.75)th observation
= value of (5.25)th observation
= value of 5th observation + 0.25(value of 6th observation – value of 5th observation)
= 62 + 0.25(80 – 62)
= 62 + 0.25(18)
= 62 + 4.5
= 66.5
∴ Q.D. = \(\frac{Q_{3}-Q_{1}}{2}=\frac{66.5-33}{2}=\frac{33.5}{2}\) = 16.75
Question 5.
Calculate Q.D. from the following data.
Solution:
We construct the less than cumulative frequency table as follows:
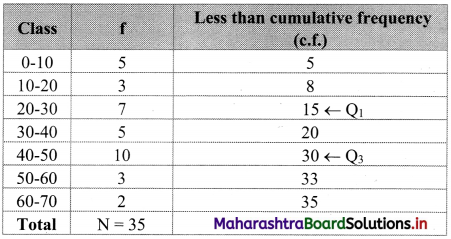
Here, N = 35
Q
1
class = class containing \(\left(\frac{N}{4}\right)^{\text {th }}\) observation
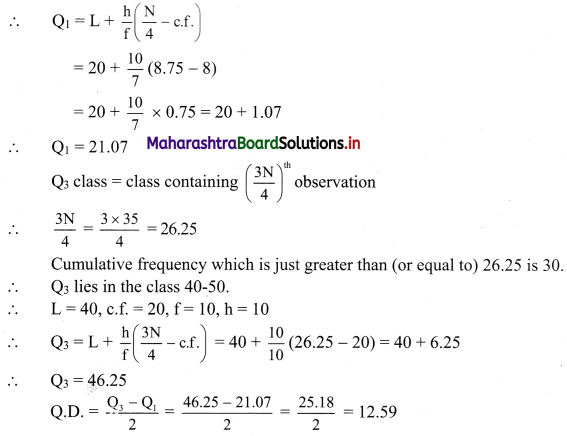
∴ \(\frac{\mathrm{N}}{4}=\frac{35}{4}\) = 8.75
Cumulative frequency which is just greater than (or equal to) 8.75 is 15.
∴ Q
1
lies in the class 20-30.
∴ L = 20, c.f. = 8, f = 7, h = 10
Question 6.
Calculate the appropriate measure of dispersion for the following data.
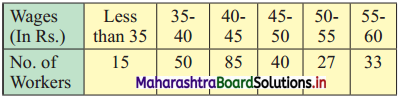
Solution:
Since open-ended classes are given, the appropriate measure of dispersion that we can compute is the quartile deviation.
We construct the less than cumulative frequency table as follows:
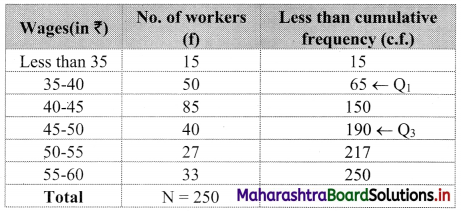
Here N = 250
Q
1
class class containing \(\left(\frac{N}{4}\right)^{t h}\) observation
∴ \(\frac{\mathrm{N}}{4}=\frac{250}{4}\) = 62.5
Cumulative frequency which is just greater than (or equal to) 62.5 is 65.
∴ Q
1
lies in the class 35-40.
∴ L = 35, c.f. = 15, f = 50, h = 5
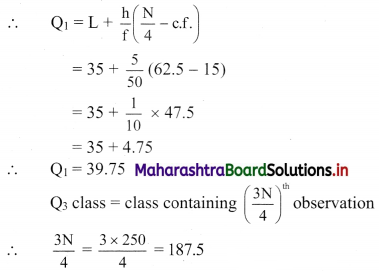
The cumulative frequency which is just greater than (or equal to) 187.5 is 190.
∴ Q
3
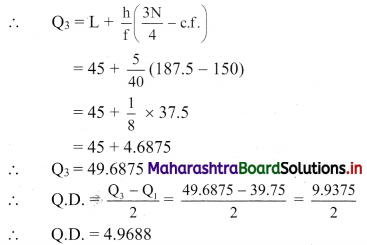
lies in the class 45-50.
∴ L = 45, c.f. = 150, f = 40, h = 5
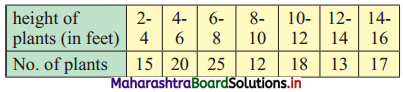
Question 7.
Calculate Q.D. of the following data.
Solution:
We construct the less than cumulative frequency table as follows:
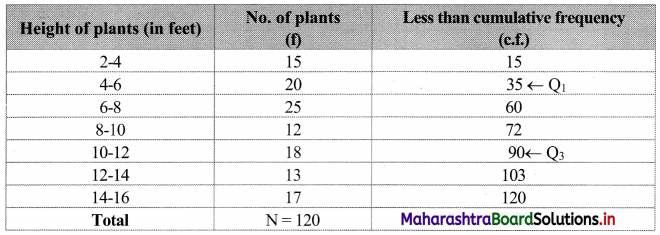
Here, N = 120
Q
1
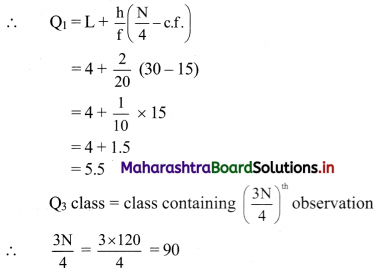
class = class containing \(\left(\frac{\mathrm{N}}{4}\right)^{\mathrm{th}}\) observation
∴ \(\frac{\mathrm{N}}{4}=\frac{120}{4}\) = 30
Cumulative frequency which is just greater than (or equal to) 30 is 35.
∴ Q
1
lies in the class 4-6.
∴ L = 4, c.f. = 15, f = 20, h = 2
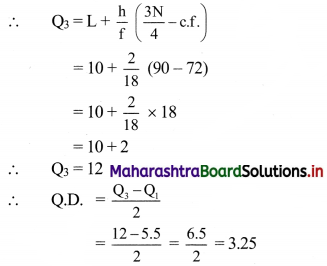
Cumulative frequency which is just greater than (or equal to) 90 is 90.
∴ Q
3
lies in the class 10-12.
∴ L = 10, c.f. = 72, f = 18, h = 2
Question 8.
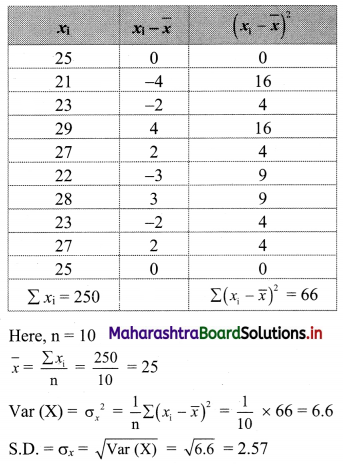
Find variance and S.D. for the following set of numbers.
25, 21, 23, 29, 27, 22, 28, 23, 27, 25 (Given √6.6 = 2.57)
Solution:
We prepare the following table for the calculation of variance and S.D.:
Question 9.
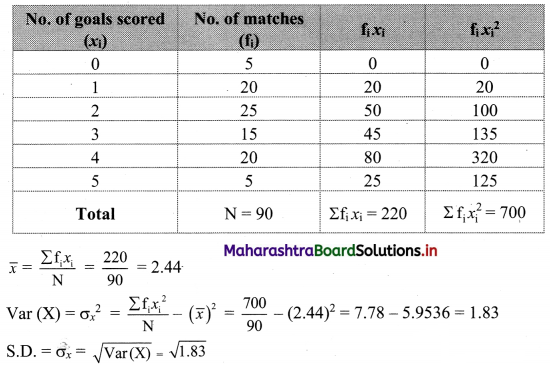
Following data gives no. of goals scored by a team in 90 matches.
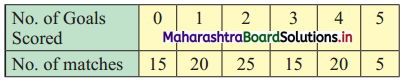
Compute the variance and standard deviation for the above data.
Solution:
We prepare the following table for the calculation of variance and S.D:
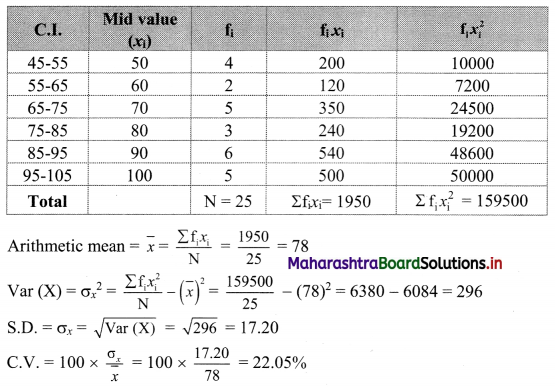
Question 10.
Compute the arithmetic mean and S.D. and C.V. (Given √296 = 17.20)
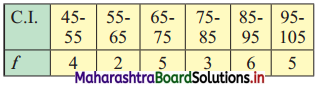
Solution:
We prepare the following table for calculation of arithmetic mean and S.D.:
Question 11.
The mean and S.D. of 200 items are found to be 60 and 20 respectively. At the time of calculation, two items were wrongly taken as 3 and 67 instead of 13 and 17. Find the correct mean and variance.
Solution:
Here, n = 200, \(\bar{x}\) = Mean = 60, S.D. = 20
Wrongly taken items are 3 and 67.
Correct items are 13 and 17.
Now, \(\bar{x}\) = 60
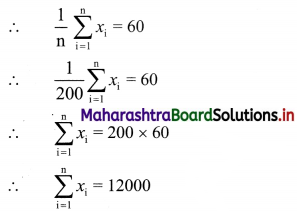
Correct value of \(\sum_{i=1}^{n} x_{i}=\sum_{i=1}^{n} x_{i}\) (sum of wrongly taken items) + (sum of correct items)
= 12000 – (3 + 67) + (13 + 17)
= 12000 – 70 + 30
= 11960
Correct value of mean = \(\frac{1}{n}\) × correct value of \(\sum_{i=1}^{n} x_{i}\)
= \(\frac{1}{200}\) × 11960
= 59.8
Now, S.D. = 20
Variance = (S.D.)
2
= 20
2
∴ Variance = 400
∴ \(\frac{1}{\mathrm{n}} \sum_{\mathrm{i}=1}^{\mathrm{n}} x_{\mathrm{i}}^{2}-(\bar{x})^{2}=400\)
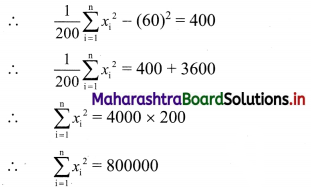
Correct value of \(\sum_{i=1}^{n} x_{i}^{2}\)
= \(\sum_{i=1}^{n} x_{i}^{2}\) – (Sum of squares of wrongly taken items) + (Sum of squares of correct items)
= 800000 – (3
2
+ 67
2
) + (13
2
+ 17
2
)
= 800000 – (9 + 4489) + (169 + 289)
= 800000 – 4498 + 458
= 795960
∴ Correct value of Variance = (\(\frac{1}{n}\) × \(\sum_{i=1}^{n} x_{i}^{2}\)) – (correct value of \(\bar{x}\))
2
= \(\frac{1}{200}\) × 795960 – (59.8)
2
= 3979.8 – 3576.04
= 403.76
∴ The correct mean is 59.8 and correct variance is 403.76.
Question 12.
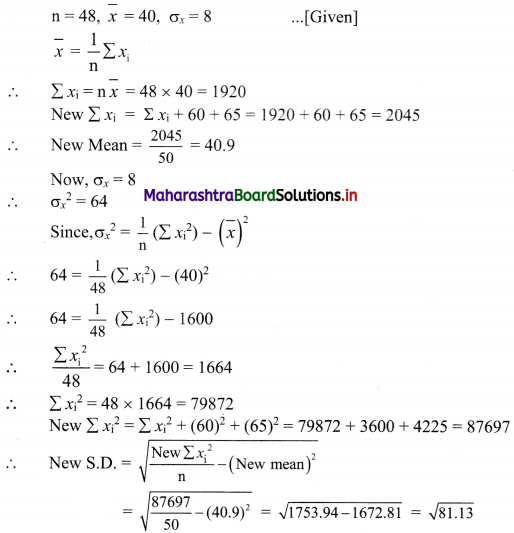
The mean and S.D. of a group of 48 observations are 40 and 8 respectively. If two more observations 60 and 65 are added to the set, find the mean and S.D. of 50 items.
Solution:
Question 13.
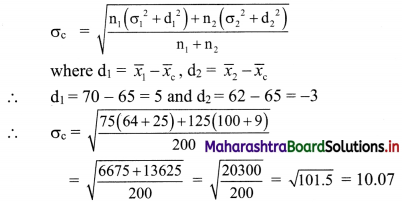
The mean height of 200 students is 65 inches. The mean heights of boys and girls are 70 inches and 62 inches respectively and the standard deviations are 8 and 10 respectively. Find the number of boys and combined S.D.
Solution:
Let n
1
and n
2
be the number of boys and girls respectively.
Let n = 200, \(\bar{x}_{\mathrm{c}}\) = 65, \(\bar{x}_{1}\) = 70, \(\bar{x}_{1}\) = 62, σ
1
= 8, σ
2
= 10
Here, n
1
+ n
2
= n
∴ n
1
+ n
2
= 200 …….(i)
Combined mean is given by
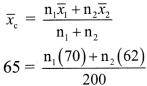
∴ 70n
1
+ 62n
2
= 13000
∴ 35n
1
+ 31n
2
= 6500 ……..(ii)
Solving (i) and (ii), we get
n
1
= 75, n
2
= 125
Combined standard deviation is given by,
Question 14.
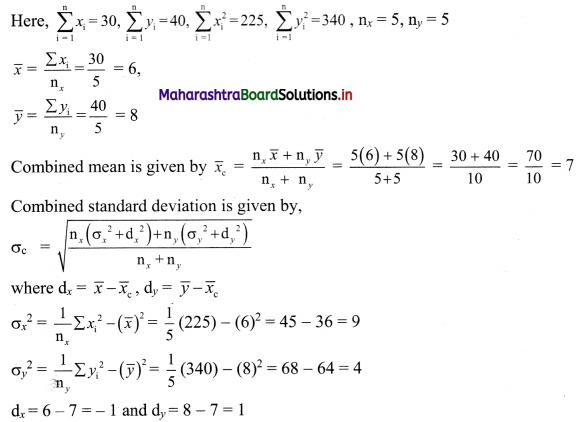
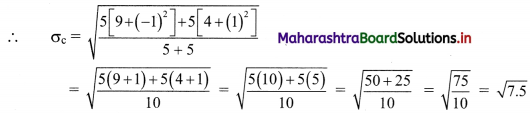
From the following data available for 5 pairs of observations of two variables x and y, obtain the combined S.D. for all 10 observations,
where \(\sum_{i=1}^{n} x_{i}=30, \sum_{i=1}^{n} y_{i}=40, \sum_{i=1}^{n} x_{i}^{2}=225, \sum_{i=1}^{n} y_{i}^{2}=340\)
Solution:
Question 15.
The mean and standard deviations of two brands of watches are given below:
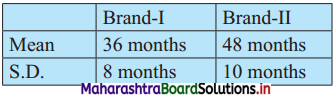
Calculate the coefficient of variation of the two brands and interpret the results.
Solution:
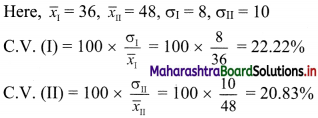
Since C.V. (I) > C.V. (II)
∴ the brand I is more variable.
Question 16.
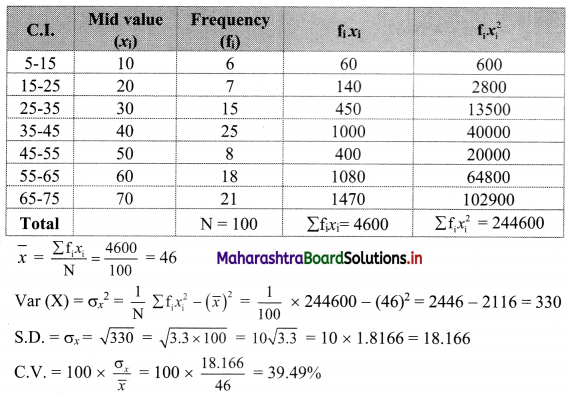
Calculate the coefficient of variation for the data given below. [Given √3.3 = 1.8166]
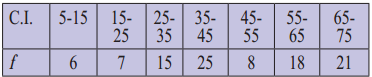
Solution: