Skewness Class 11 Commerce Maths 2 Chapter 3 Miscellaneous Exercise 3 Answers Maharashtra Board
Balbharati Maharashtra State Board 11th Commerce Maths Solution Book Pdf Chapter 3 Skewness Miscellaneous Exercise 3 Questions and Answers.
Std 11 Maths 2 Miscellaneous Exercise 3 Solutions Commerce Maths
Question 1.
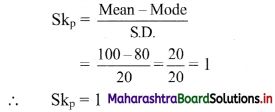
For u distribution, mean = 100, mode = 80 and S.D. = 20. Find Pearsonian coefficient of skewness Sk
p
.
Solution:
Given, Mean = 100, Mode = 80, S.D. = 20
Question 2.
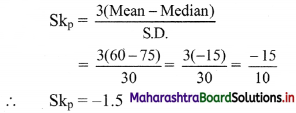
For a distribution, mean = 60, median = 75 and variance = 900. Find Pearsonian coefficient of skewness Sk
p
.
Solution:
Given. Mean = 60, Median = 75, Variance = 900
∴ S.D. = √Variance = √900 = 30

Question 3.
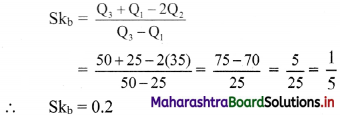
For a distribution, Q
1
= 25, Q
2
= 35 and Q
3
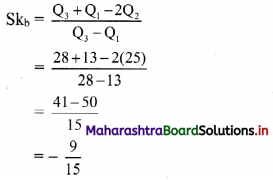
= 50. Find Bowley’s coefficient of skewness Sk
b
.
Solution:
Given Q
1
= 25, Q
2
= 35, Q
3
= 50
Question 4.
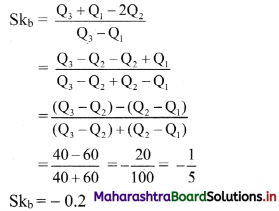
For a distribution Q
3
– Q
2
= 40, Q
2
– Q
1
= 60. Find Bowlev’s coefficient of skewness Sk
b
.
Solution:
Given, Q
3
– Q
2
= 40, Q
2
– Q
1
= 60
Question 5.
For a distribution, Bowley’s coefficient of skewness is 0.6. The sum of upper and lower quartiles is 100 and median is 38. Find the upper and lower quartiles.
Solution:
Given, Sk
b
= 0.6, Q
3
+ Q
1
= 100,
Median = Q
2
= 38
Skb = \(\frac{Q_{3}+Q_{1}-2 Q_{2}}{Q_{3}-Q_{1}}\)
∴ 0.6 = \(\frac{100-2(38)}{Q_{3}-Q_{1}}\)
∴ 0.6(Q
3
– Q
1
) = 100 – 76 = 24
∴ Q
3
– Q
1
= 40 ….(i)
Q
3
+ Q
1
= 100 …..(ii) (given)
Adding (i) and (ii), we get
2Q
3
= 140
∴ Q
3
= 70
Substituting the value of Q
3
in (ii), we get
70 + Q
1
= 100
∴ Q
1
= 100 – 70 = 30
∴ upper quartile = 70 and lower quartile = 30
Question 6.
For a frequency distribution, the mean is 200, the coefficient of variation is 8% and Karl Pearsonian’s coefficient of skewness is 0.3. Find the mode and median of the distribution.
Solution:
Mean = \(\bar{x}\) = 200
Coefficient of variation, C.V. = 8%, Skp = 0.3
C.V. = \(\frac{\sigma}{\bar{x}} \times 100\), where σ = standard deviation
∴ 8 = \(\frac{\sigma}{200} \times 100\)
∴ σ = \(\frac{8 \times 200}{100}\) = 16
Now, Sk
p
= \(\frac{\text { Mean – Mode }}{\text { S.D. }}\)
∴ 0.3 = \(\frac{200-\text { Mode }}{16}\)
∴ 0.3 × 16 = 200 – Mode
∴ Mode = 200 – 4.8 = 195.2
Since, Mean – Mode = 3(Mean – Median)
∴ 200 – 195.2 = 3(200 – Median)
∴ 4.8 = 600 – 3Median
∴ 3Median = 600 – 4.8 = 595.2
∴ Median = 198.4
Question 7.
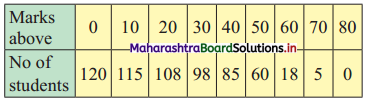
Calculate Karl Pearsonian’s coefficient of skewness Skp from the follow ing data:
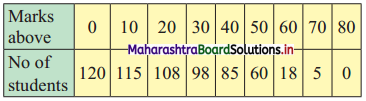
Solution:
The given table is the cumulative frequency table of more than type.
From this table, we have to prepare the frequency distribution table and then calculate the value of Sk
p
.
Construct the following table:
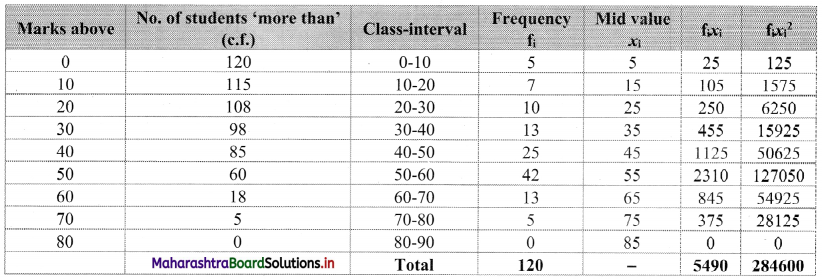
From the table, N = 120, Σf
i
x
i
= 5490 and \(\sum \mathrm{f}_{\mathrm{i}} x_{\mathrm{i}}^{2}\) = 284600
Mean = \(\bar{x}=\frac{\sum f_{i} x_{i}}{N}=\frac{5490}{120}\) = 45.75
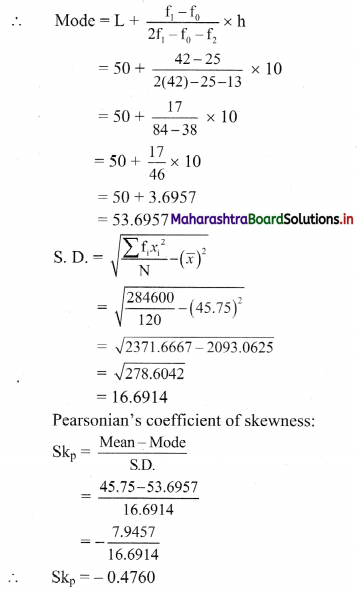
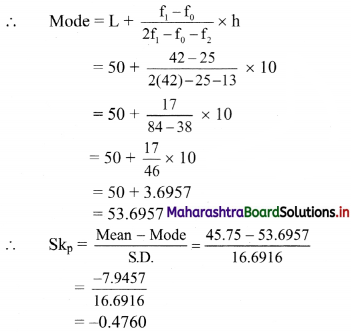
Maximum frequency 42 is of the class 50 – 60
∴ Mode lies in the class 50 – 60
∴ L = 50, f
1
= 42, f
0
= 25, f
2
= 13, h = 10
Alternate Method:
Let u = \(\frac{x-45}{10}\)
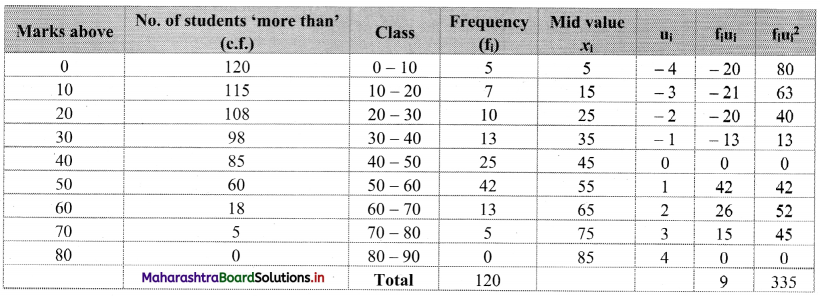
\(\overline{\mathrm{u}}=\frac{\sum \mathrm{f}_{\mathrm{i}} \mathrm{u}_{\mathrm{i}}}{\mathrm{N}}=\frac{9}{120}\) = 0.075
∴ \(\bar{x}\) = 45 + 10(\(\bar{u}\))
= 45 + 10(0.075)
= 45 + 0.75
= 45.75
Var(u) = \(\sigma_{u}^{2}=\frac{\sum f_{i} u_{i}{ }^{2}}{N}-(\bar{u})^{2}\)
= \(\frac{335}{120}\) – (0.075)
2
= 2.7917 – 0.0056
= 2.7861
Var(X) = h
2
× Var(u)
= 100 × 2.7861
= 278.61
S.D. = √278.61 = 16.6916
Maximum frequency 42 is of the class 50 – 60.
∴ Mode lies in the class 50 – 60.
∴ L = 50, f
1
= 42, f
0
= 25, f
2
= 13, h = 10
Question 8.
Calculate Bowley’s coefficient of skewness Skb from the following data.
Solution:
To calculate Bowley’s coefficient of skewness Skb, we construct the following table:
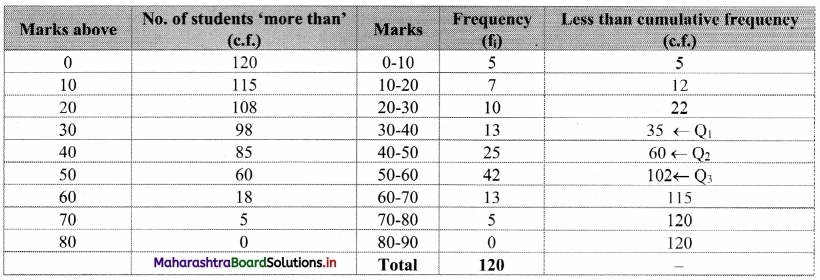
Here, N = 120
Q
1
class = class containing the \(\left(\frac{N}{4}\right)^{t h}\) observation
∴ \(\frac{N}{4}=\frac{120}{4}\) = 30
Cumulative frequency which is just greater than (or equal to) 30 is 35.
∴ Q
1
lies in the class 30-40.
∴ L = 30, h = 10, f = 13, c.f. = 22
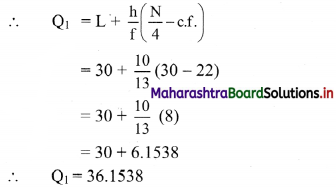
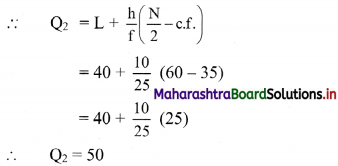
Q
2
class = class containing the \(\left(\frac{N}{2}\right)^{t h}\) observation
∴ \(\frac{\mathrm{N}}{2}=\frac{120}{2}\) = 60
Cumulative frequency which is just greater than (or equal to) 60 is 60.
∴ Q
2
lies in the class 40-50.
∴ L = 40, h = 10, f = 25, c.f. = 35
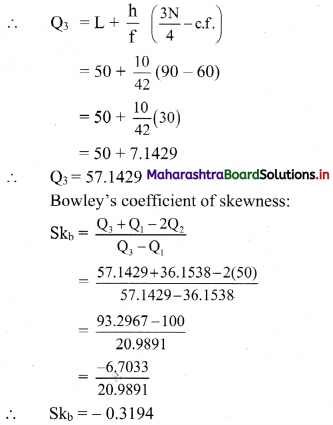
Q
3
class = class containing the \(\left(\frac{3 \mathrm{~N}}{4}\right)^{\text {th }}\) observation
∴ \(\frac{3 \mathrm{~N}}{4}=\frac{3 \times 120}{4}\) = 90
Cumulative frequency which is just greater than (or equal to) 90 is 102.
∴ Q
3
lies in the class 50 – 60
∴ L = 50, h = 10, f = 42, c.f. = 60
Question 9.
Find Sk
p
for the following set of observations:
18, 27, 10, 25, 31, 13, 28
Solution:
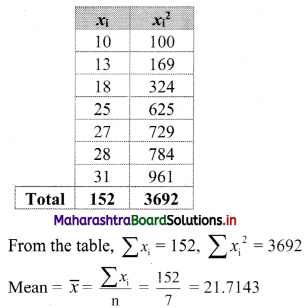
The given data can be arranged in ascending order as follows:
10, 13, 18, 25, 27, 28, 31
Here, n = 7
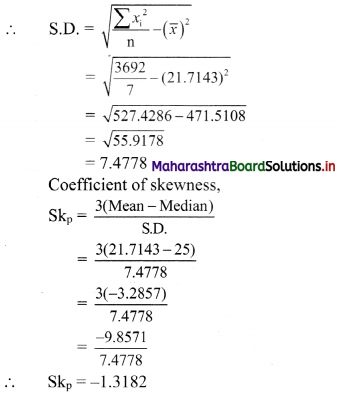
∴ Median = value of \(\left(\frac{n+1}{2}\right)^{\text {th }}\) observation
= value of \(\left(\frac{7+1}{2}\right)^{\text {th }}\) observation
= value of 4th observation
= 25
For finding standard deviation, we construct the following table:
Question 10.
Find Skb for the following set of observations:
18, 27, 10, 25, 31, 13, 28
Solution:
The given data can be arranged in ascending order as follows:
10, 13, 18, 25, 27, 28, 31
Here, n = 7
∴ Q
1
= value of \(\left(\frac{n+1}{4}\right)^{\text {th }}\) observation
= value of \(\left(\frac{7+1}{4}\right)^{\text {th }}\) observation
= value of 2nd observation
∴ Q
1
= 13
Q
2
= value of 2\(\left(\frac{n+1}{4}\right)^{\text {th }}\) observation
= value of 2\(\left(\frac{7+1}{4}\right)^{\text {th }}\) observation
= value of (2 × 2)th observation
= value of 4th observation
∴ Q
2
= 25
Q
3
= value of 3\(\left(\frac{n+1}{4}\right)^{\text {th }}\) observation
= value of 3\(\left(\frac{7+1}{4}\right)^{\text {th }}\) observation
= value of (3 × 2)th observation
= value of 6th observation
∴ Q
3
= 28
Coefficient of skewness,
∴ Sk
b
= -0.6