
Bar Graphs Class 6 Maths Chapter 6 Practice Set 18 Solutions Maharashtra Board
Std 6 Maths Practice Set 18 Solutions Answers
Question 1.
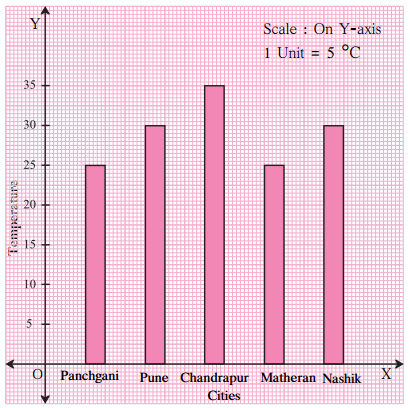
This bar graph shows the maximum temperatures in degrees Celsius in different cities on a certain day in February. Observe the graph and answer the questions:
- What data is shown on the vertical and the horizontal lines?
- Which city had the highest temperature?
- Which cities had equal maximum temperatures?
- Which cities had a maximum temperature of 30 °C?
- What is the difference between the maximum temperatures of Panchgani and Chandrapur?
Solution:
- Temperature is shown on the vertical line and cities are shown on the horizontal line.
- The city Chandrapur had the highest temperature.
- Pune and Nashik had the equal maximum temperature of 30°C and Panchgani and Matheran had the equal maximum temperature of 25°C.
- Pune and Nashik had a maximum temperature of 30 °C.
-
The difference between the maximum temperatures of Panchgani and Chandrapur can be calculated as Difference in temperature = Temperature of Chandrapur – Temperature of Panchgani
= 35°C – 25°C
= 10°C
Maharashtra Board Class 6 Maths Chapter 6 Bar Graphs Practice Set 18 Intext Questions and Activities
Question 1.
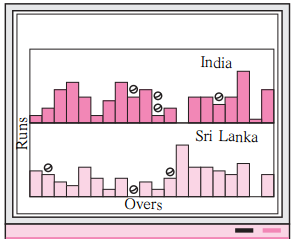
Observe the picture alongside: (Textbook pg. no. 35)
- To which sport is this data related?
- How many things does the picture tell us about?
- What shape has been used in the picture to represent runs?
Ans:
- The given data is related to cricket.
- The picture tells about runs scored in different overs by India and Srilanka. The represents the wickets fallen in that over.
- To represent runs, rectangular or bar shape is used.
Question 2.
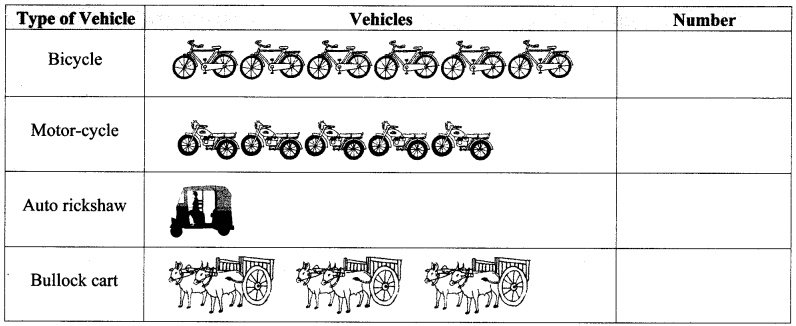
A pictogram of the types and numbers of vehicles in a city is given below.
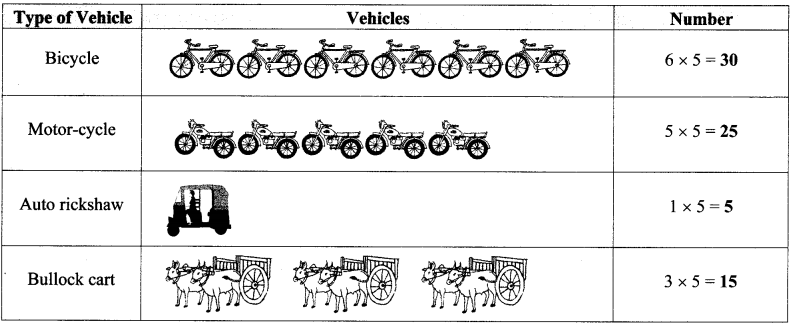
Taking 1 picture = 5 vehicles, write the numbers in the pictogram. (Textbook pg. no.35)
Solution:
Drawing pictograms is time consuming.
Sometimes, it is practically not possible to draw pictures for the given values (for example population of villages etc). In such cases, representing the data by making use of graphs can serve the purpose. Such data can be represented by using graphs.