Balbharti Maharashtra State Board Class 8 Maths Solutions covers the Practice Set 11.2 8th Std Maths Answers Solutions Chapter 11 Statistics.
Statistics Class 8 Maths Chapter 11 Practice Set 11.2 Solutions Maharashtra Board
Std 8 Maths Practice Set 11.2 Chapter 11 Solutions Answers
practice set 11.2 8th class Question 1.
Observe the following graph and answer the questions.
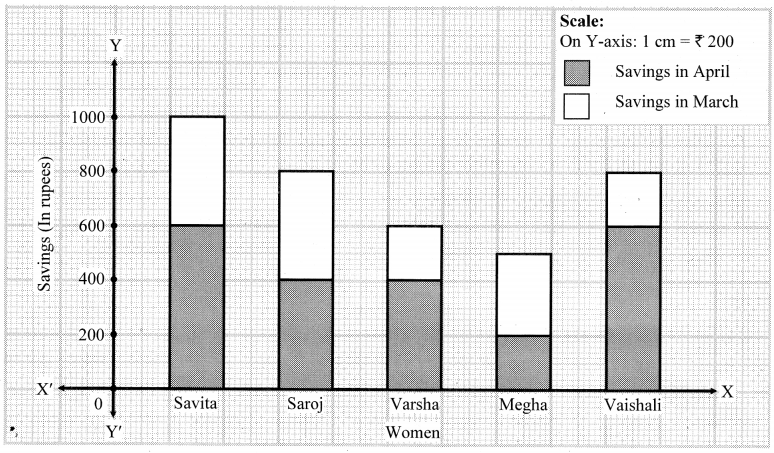
i. State the type of the graph.
ii. How much is the savings of Vaishali in the month of April?
iii. How much is the total of savings of Saroj in the months March and April?
iv. How much more is the total savings of Savita than the total savings of Megha?
v. Whose savings in the month of April is the least?
Solution:
i. The given graph is a subdivided bar graph.
ii. Vaishali’s savings in the month of April is Rs 600.
iii. Total savings of Saroj in the months of March and April is Rs 800.
iv. Savita’s total saving = Rs 1000, Megha’s total saving = Rs 500
∴ difference in their savings = 1000 – 500 = Rs 500.
Savita’s saving is Rs 500 more than Megha.
v. Megha’s savings in the month of April is the least.
practice set 11.2 Question 2.
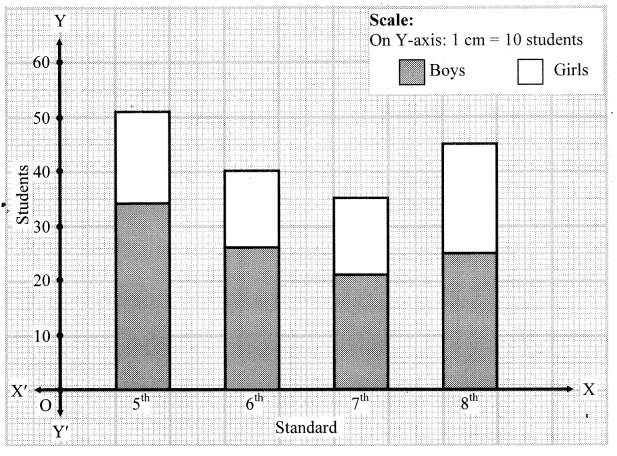
The number of boys and girls, in std 5 to std 8 in a Z.P. School is given in the table. Draw a subdivided bar graph to show the data. (Scale : On Y axis, 1cm = 10 students)
| Standard | 5th | 6th | 7th | 8th |
| Boys | 34 | 26 | 21 | 25 |
| Girls | 17 | 14 | 14 | 20 |
Solution:
| Standard | 5th | 6th | 7th | 8th |
| Boys | 34 | 26 | 21 | 25 |
| Girls | 17 | 14 | 14 | 20 |
| Total | 51 | 40 | 35 | 45 |
Statistics class 8 practice set 11.1 Question 3.
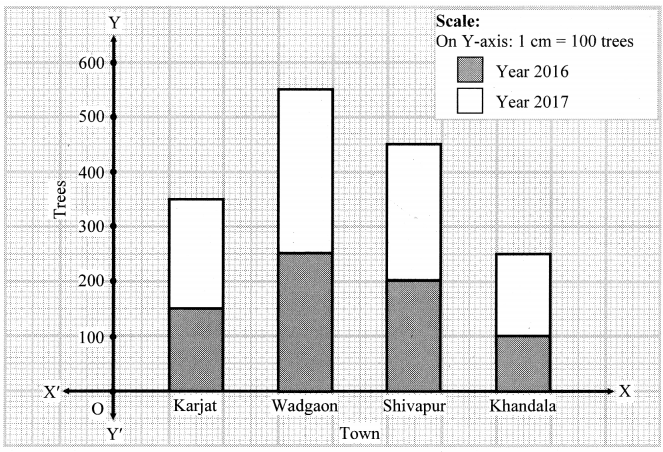
In the following table number of trees planted in the year 2016 and 2017 in four towns is given. Show the data with the help of subdivided bar graph.
| Year\Town | karjat | Wadgaon | Shivapur | Khandala |
| 2016 | 150 | 250 | 200 | 100 |
| 2017 | 200 | 300 | 250 | 150 |
Solution:
| Year\Town | karjat | Wadgaon | Shivapur | Khandala |
| 2016 | 150 | 250 | 200 | 100 |
| 2017 | 200 | 300 | 250 | 150 |
| Total | 350 | 550 | 450 | 250 |
Statistics class 8 Question 4.
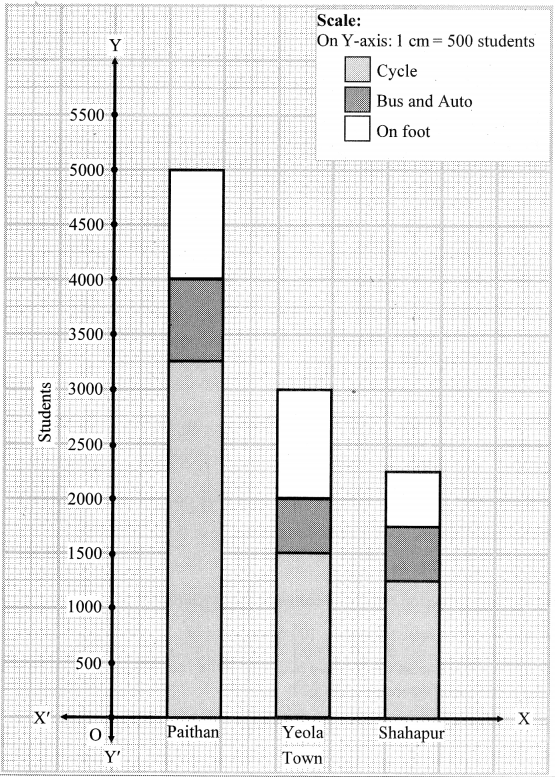
In the following table, data of the transport means used by students in 8th standard for commutation between home and school is given. Draw a subdivided bar diagram to show the data.
(Scale: On Y axis: 1 cm = 500 students)
| Means of commutation\Town | Paithan | Yeola | Shahapur |
| Cycle | 3250 | 1500 | 1250 |
| Bus and auto | 750 | 500 | 500 |
| On foot | 1000 | 1000 | 500 |
Solution:
| Means of commutation\Town | Paithan | Yeola | Shahapur |
| Cycle | 3250 | 1500 | 1250 |
| Bus and auto | 750 | 500 | 500 |
| On foot | 1000 | 1000 | 500 |
| Total | 5000 | 3000 | 2250 |