Time Series Class 12 Commerce Maths 2 Chapter 4 Exercise 4.1 Answers Maharashtra Board
Balbharati Maharashtra State Board 12th Commerce Maths Digest Pdf Chapter 4 Time Series Ex 4.1 Questions and Answers.
Std 12 Maths 2 Exercise 4.1 Solutions Commerce Maths
Question 1.
The following data gives the production of bleaching powder (in ‘000 tonnes) for the years 1962 to 1972.
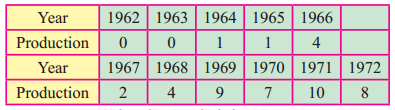
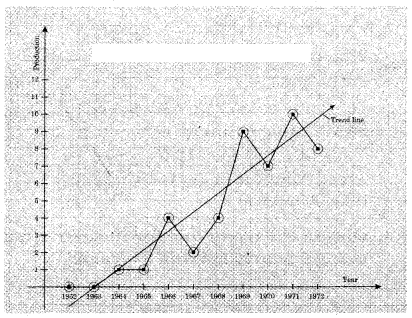
Fit a trend line by graphical method to the above data.
Solution:
Question 2.
Use the method of least squares to fit a trend line to the data in problem 1 above. Also, obtain the trend value for the year 1975.
Solution:
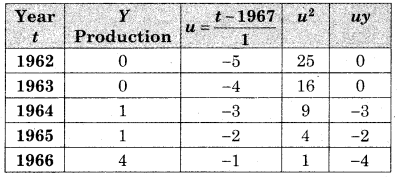
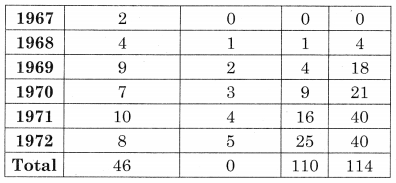
n = 11, let the trend line the
y = a + bu ……..(I)
Σy = na + bΣu ……..(i)
Σuy = aΣu + bΣu
2
………(ii)
Substituting the values of Σy, Σu, Σuy, & Σu
2
, we get
46 = 11a + 0
∴ a = 4.18 And
114 = 0 + b(110)
∴ b = 1.04
By (I) the equation of the trends line is
y = 4.18 + 1.04u
Where u = t – 1967 ……..(iii)
For the year 1975 we have u = 8
Substituting in (iii) we get
Y= 4.18 + 1.04(8) = 12.5
Trend value for the year 1975 is 12.5 (in ‘000 tonnes).

Question 3.
Obtain the trend line for the above data using 5 yearly moving averages.
Solution:
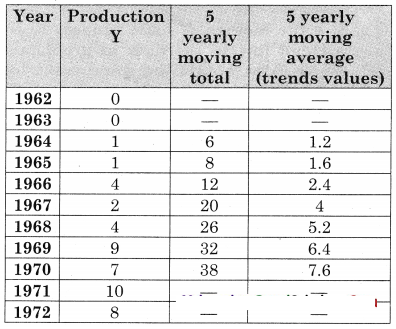
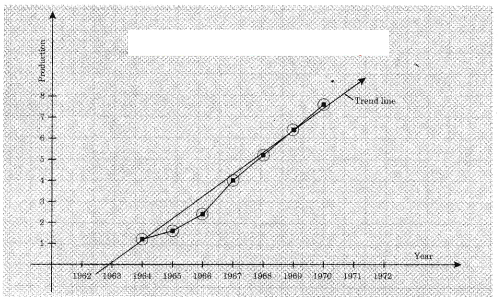
Question 4.
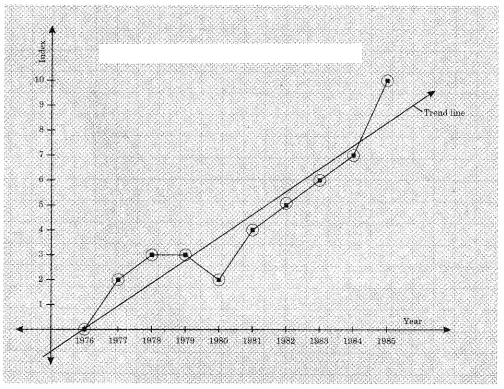
The following table shows the index of industrial production for the period from 1976 to 1985, using the year 1976 as the base year.
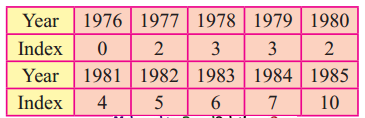
Fit a trend line to the above data by graphical method.
Solution:
Question 5.
Fit a trend line to the data in problem 4 above by the method of least squares. Also, obtain the trend value for the index of industrial production for the year 1987.
Solution:
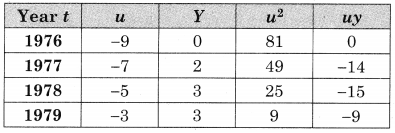
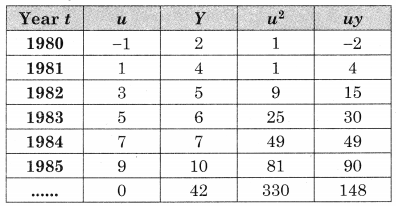
u = \(\frac{t-1980.5}{\frac{1}{2}}\), n = 10, Σu = 0, Σy = 42, Σu
2
= 330, Σuy = 148
Let the trend line be y = a + bu ……(i)
where u = \(\frac{t-1980.5}{\frac{1}{2}}\)
i.e. u = 2t – 3961
Σy = na + bΣu ……(ii)
Σuy = aΣu + bΣu
2
……….(iii)
Substituting the values of Σy, n, Σu, Σuy & Σu
2
We get
42 = 10a + 0
∴ a = 4.2 and
148 = 0 + 5.330
∴ b = 0.4485
∴ by (i) the equation of the trends line is
Y = 4.2 + 0.4485u ………(iv)
where u = 2t – 3961
For the year 1987,
u = 13 by (iv) we have
Y = 4.2 + 0.4485(13) = 10.0305
∴ The trend value for the year 1987 is 10.0305
Question 6.
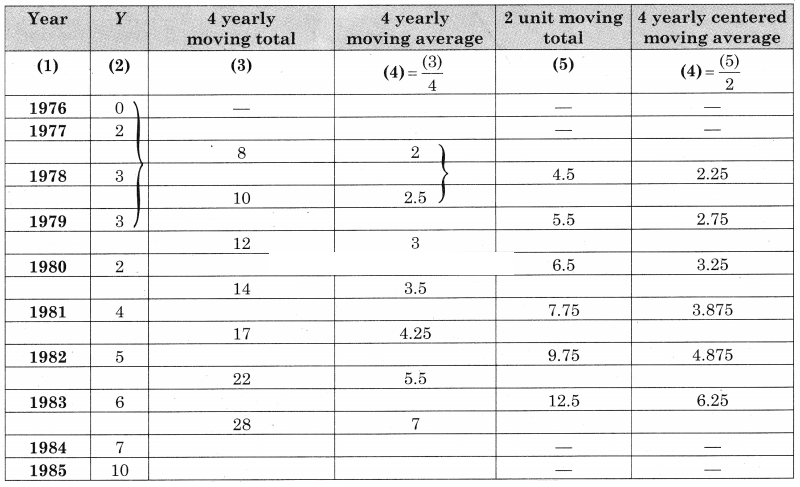
Obtain the trend values for the data in problem 4 using 4-yearly centered moving averages.
Solution:
Question 7.
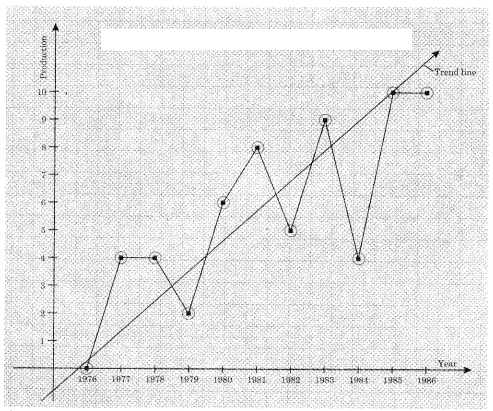
The following table gives the production of steel (in millions of tonnes) for the years 1976 to 1986.
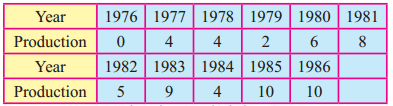
Fit a trend line to the above data by the graphical method.
Solution:
Question 8.
Fit a trend line to the data in Problem 7 by the method of least squares. Also, obtain the trend value for the year 1990.
Solution:
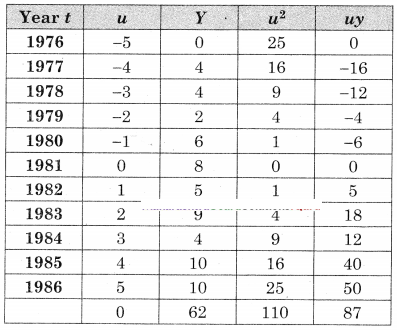
u = \(\frac{t-1981}{1}\), n = 10, Σu = 0, ΣY = 62, Σu
2
= 110, Σuy = 87
Let the equation of the trend line be
Y = a + bu
where u = t – 1981 ……(i)
ΣY = na + bΣu ………(ii)
Σuy = aΣu + bΣu
2
………(iii)
Substituting the values of Σy, n, Σu, Σuy, Σu
2
in (ii) & (iii)
62 = 11a + 0
∴ a = 5.6364 And
87 = 0 + 5(110)
∴ b = 0.7909
∴ by (i) equation of the trend line is y = 5.6364 + 0.7909u
Where u = t – 1981
For the year 1990,
u = 9
∴ y = 5.6364 + 0.7909(9)
∴ y = 12.7545 (in million tonnes)
Question 9.
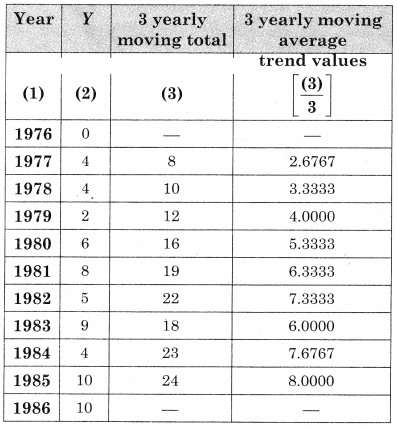
Obtain the trend values for the above data using 3-yearly moving averages.
Solution:
Question 10.
The following table shows the production of gasoline in the U.S.A. for the years 1962 to 1976.
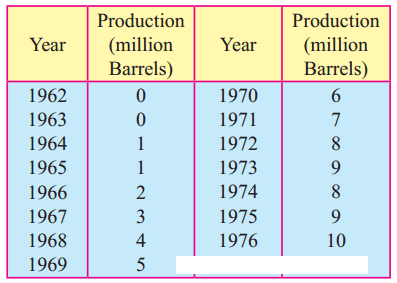
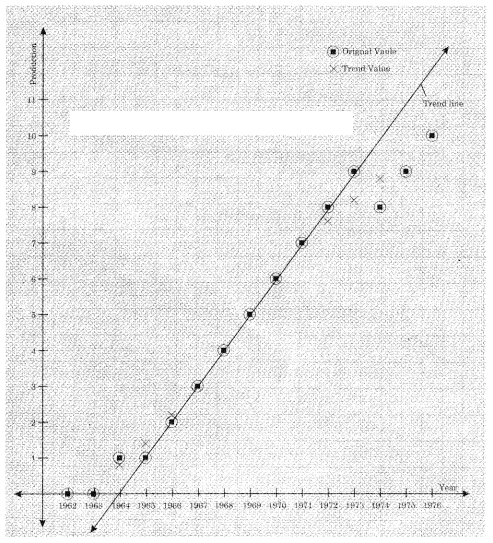
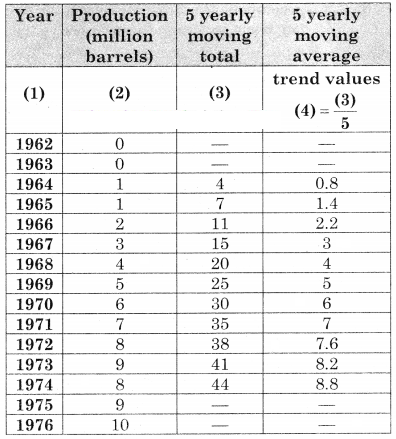
(i) Obtain trend values for the above data using 5-yearly moving averages.
(ii) Plot the original time series and trend values obtained above on the same graph.
Solution:
(i)
(ii)